FastlyInc FSLY full analysis,charts,indicators,moving averages,SMA,DMA,EMA,ADX,MACD,RSIFastly Inc FSLY WideScreen charts, DMA,SMA,EMA technical analysis, forecast prediction, by indicators ADX,MACD,RSI,CCI NYSE stock exchange
Daily price and charts and targets FastlyInc Strong Daily Stock price targets for FastlyInc FSLY are 10.63 and 11.08 | Daily Target 1 | 10.54 | | Daily Target 2 | 10.71 | | Daily Target 3 | 10.99 | | Daily Target 4 | 11.16 | | Daily Target 5 | 11.44 |
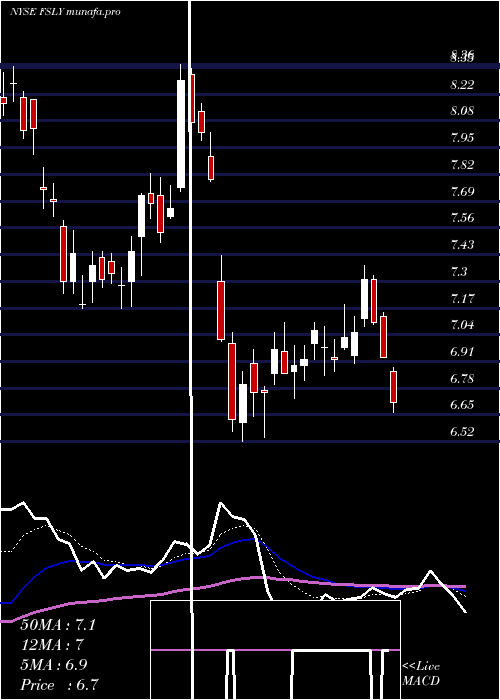
Daily price and volume Fastly Inc
| Date |
Closing |
Open |
Range |
Volume |
Tue 09 December 2025 |
10.88 (-2.16%) |
11.24 |
10.82 - 11.27 |
0.8177 times |
Mon 08 December 2025 |
11.12 (5.7%) |
10.56 |
10.31 - 11.25 |
3.2475 times |
Fri 05 December 2025 |
10.52 (-8.68%) |
11.57 |
10.20 - 11.79 |
1.9677 times |
Thu 04 December 2025 |
11.52 (-1.87%) |
11.29 |
11.03 - 11.60 |
0.9965 times |
Wed 03 December 2025 |
11.74 (0.69%) |
11.74 |
11.32 - 11.74 |
0.5143 times |
Tue 02 December 2025 |
11.66 (-0.85%) |
11.82 |
11.46 - 12.59 |
0.4347 times |
Mon 01 December 2025 |
11.76 (0.86%) |
11.45 |
11.20 - 11.78 |
0.4838 times |
Fri 28 November 2025 |
11.66 (-1.85%) |
11.82 |
11.53 - 11.85 |
0.2478 times |
Wed 26 November 2025 |
11.88 (-3.73%) |
12.32 |
11.41 - 12.60 |
0.5483 times |
Tue 25 November 2025 |
12.34 (6.1%) |
11.54 |
11.36 - 12.42 |
0.7418 times |
Mon 24 November 2025 |
11.63 (6.6%) |
11.02 |
10.93 - 11.63 |
0.4715 times |
Weekly price and charts FastlyInc Strong weekly Stock price targets for FastlyInc FSLY are 10.6 and 11.56 | Weekly Target 1 | 9.86 | | Weekly Target 2 | 10.37 | | Weekly Target 3 | 10.82 | | Weekly Target 4 | 11.33 | | Weekly Target 5 | 11.78 |
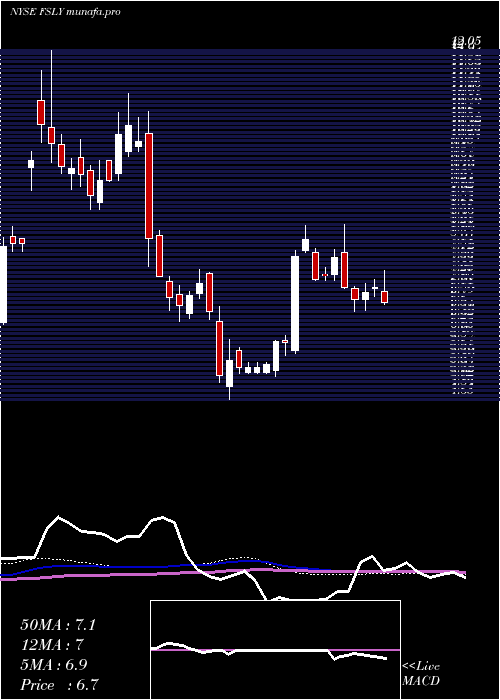
Weekly price and volumes for Fastly Inc
| Date |
Closing |
Open |
Range |
Volume |
Tue 09 December 2025 |
10.88 (3.42%) |
10.56 |
10.31 - 11.27 |
1.4149 times |
Fri 05 December 2025 |
10.52 (-9.78%) |
11.45 |
10.20 - 12.59 |
1.5304 times |
Fri 28 November 2025 |
11.66 (6.87%) |
11.02 |
10.93 - 12.60 |
0.6994 times |
Fri 21 November 2025 |
10.91 (-2.85%) |
11.49 |
10.07 - 11.51 |
1.2433 times |
Fri 14 November 2025 |
11.23 (-2.77%) |
11.75 |
10.90 - 12.54 |
1.3306 times |
Fri 07 November 2025 |
11.55 (39.32%) |
8.21 |
7.95 - 11.66 |
1.939 times |
Fri 31 October 2025 |
8.29 (0%) |
8.09 |
8.03 - 8.36 |
0.1187 times |
Fri 31 October 2025 |
8.29 (-0.48%) |
8.45 |
7.90 - 8.48 |
0.517 times |
Fri 24 October 2025 |
8.33 (4.39%) |
7.99 |
7.93 - 8.45 |
0.5312 times |
Fri 17 October 2025 |
7.98 (-3.04%) |
8.36 |
7.60 - 8.58 |
0.6757 times |
Fri 10 October 2025 |
8.23 (-6.58%) |
8.92 |
7.98 - 9.14 |
0.9209 times |
Monthly price and charts FastlyInc Strong monthly Stock price targets for FastlyInc FSLY are 9.35 and 11.74 | Monthly Target 1 | 8.83 | | Monthly Target 2 | 9.86 | | Monthly Target 3 | 11.223333333333 | | Monthly Target 4 | 12.25 | | Monthly Target 5 | 13.61 |
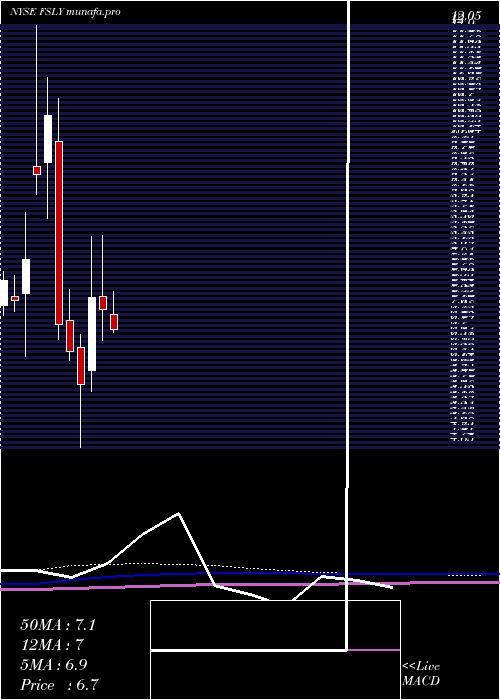
Monthly price and volumes Fastly Inc
| Date |
Closing |
Open |
Range |
Volume |
Tue 09 December 2025 |
10.88 (-6.69%) |
11.45 |
10.20 - 12.59 |
0.8281 times |
Fri 28 November 2025 |
11.66 (40.65%) |
8.21 |
7.95 - 12.60 |
1.4654 times |
Fri 31 October 2025 |
8.29 (-3.04%) |
8.35 |
7.60 - 9.18 |
0.9512 times |
Tue 30 September 2025 |
8.55 (12.35%) |
7.45 |
7.06 - 9.10 |
1.257 times |
Fri 29 August 2025 |
7.61 (12.08%) |
6.61 |
6.29 - 7.78 |
1.0392 times |
Thu 31 July 2025 |
6.79 (-3.82%) |
6.98 |
6.61 - 7.43 |
0.7055 times |
Mon 30 June 2025 |
7.06 (-3.02%) |
7.30 |
6.52 - 8.36 |
1.0392 times |
Fri 30 May 2025 |
7.28 (26.61%) |
6.00 |
5.63 - 8.35 |
0.9574 times |
Wed 30 April 2025 |
5.75 (-9.16%) |
6.41 |
4.65 - 6.63 |
0.7527 times |
Mon 31 March 2025 |
6.33 (-7.05%) |
6.87 |
6.18 - 7.41 |
1.0042 times |
Fri 28 February 2025 |
6.81 (-34.96%) |
10.01 |
6.54 - 10.76 |
1.2337 times |
DMA SMA EMA moving averages of Fastly Inc FSLY
DMA (daily moving average) of Fastly Inc FSLY
| DMA period | DMA value | | 5 day DMA | 11.16 | | 12 day DMA | 11.47 | | 20 day DMA | 11.33 | | 35 day DMA | 10.26 | | 50 day DMA | 9.7 | | 100 day DMA | 8.61 | | 150 day DMA | 8.17 | | 200 day DMA | 7.67 | EMA (exponential moving average) of Fastly Inc FSLY
| EMA period | EMA current | EMA prev | EMA prev2 | | 5 day EMA | 11.1 | 11.21 | 11.26 | | 12 day EMA | 11.21 | 11.27 | 11.3 | | 20 day EMA | 11.02 | 11.03 | 11.02 | | 35 day EMA | 10.46 | 10.43 | 10.39 | | 50 day EMA | 9.76 | 9.71 | 9.65 |
SMA (simple moving average) of Fastly Inc FSLY
| SMA period | SMA current | SMA prev | SMA prev2 | | 5 day SMA | 11.16 | 11.31 | 11.44 | | 12 day SMA | 11.47 | 11.44 | 11.42 | | 20 day SMA | 11.33 | 11.38 | 11.4 | | 35 day SMA | 10.26 | 10.18 | 10.09 | | 50 day SMA | 9.7 | 9.66 | 9.61 | | 100 day SMA | 8.61 | 8.57 | 8.53 | | 150 day SMA | 8.17 | 8.13 | 8.1 | | 200 day SMA | 7.67 | 7.65 | 7.63 |
|
|
