DunBradstreet DNB full analysis,charts,indicators,moving averages,SMA,DMA,EMA,ADX,MACD,RSIDun Bradstreet DNB WideScreen charts, DMA,SMA,EMA technical analysis, forecast prediction, by indicators ADX,MACD,RSI,CCI NYSE stock exchange
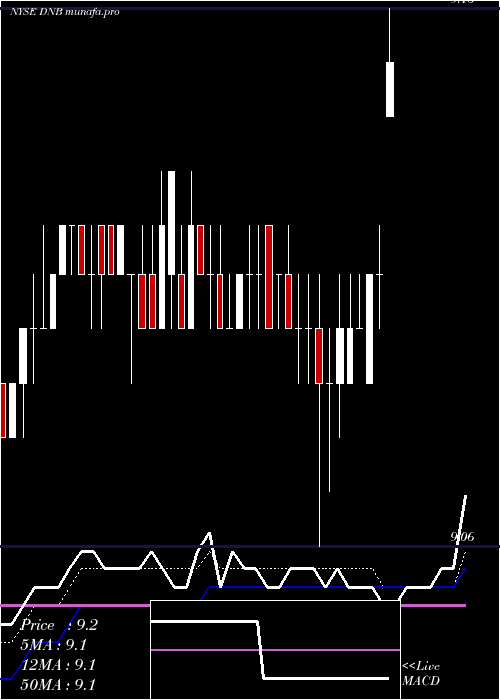
Daily price and charts and targets DunBradstreet Strong Daily Stock price targets for DunBradstreet DNB are 9.15 and 9.17 | Daily Target 1 | 9.13 | | Daily Target 2 | 9.14 | | Daily Target 3 | 9.15 | | Daily Target 4 | 9.16 | | Daily Target 5 | 9.17 |
Daily price and volume Dun Bradstreet
| Date |
Closing |
Open |
Range |
Volume |
Mon 25 August 2025 |
9.15 (0.44%) |
9.14 |
9.14 - 9.16 |
3.3951 times |
Fri 22 August 2025 |
9.11 (0%) |
9.11 |
9.10 - 9.12 |
0.4409 times |
Thu 21 August 2025 |
9.11 (0.11%) |
9.09 |
9.09 - 9.11 |
0.3807 times |
Wed 20 August 2025 |
9.10 (0%) |
9.10 |
9.10 - 9.11 |
0.4861 times |
Tue 19 August 2025 |
9.10 (0%) |
9.09 |
9.09 - 9.11 |
0.5041 times |
Mon 18 August 2025 |
9.10 (0.11%) |
9.09 |
9.08 - 9.11 |
0.6389 times |
Fri 15 August 2025 |
9.09 (0%) |
9.09 |
9.07 - 9.10 |
0.7304 times |
Thu 14 August 2025 |
9.09 (-0.11%) |
9.10 |
9.06 - 9.11 |
2.0607 times |
Wed 13 August 2025 |
9.10 (0%) |
9.10 |
9.09 - 9.11 |
0.6218 times |
Tue 12 August 2025 |
9.10 (0%) |
9.10 |
9.09 - 9.11 |
0.7414 times |
Mon 11 August 2025 |
9.10 (-0.11%) |
9.11 |
9.10 - 9.12 |
0.4089 times |
Weekly price and charts DunBradstreet Strong weekly Stock price targets for DunBradstreet DNB are 9.15 and 9.17 | Weekly Target 1 | 9.13 | | Weekly Target 2 | 9.14 | | Weekly Target 3 | 9.15 | | Weekly Target 4 | 9.16 | | Weekly Target 5 | 9.17 |
Weekly price and volumes for Dun Bradstreet
| Date |
Closing |
Open |
Range |
Volume |
Mon 25 August 2025 |
9.15 (0.44%) |
9.14 |
9.14 - 9.16 |
1.2344 times |
Fri 22 August 2025 |
9.11 (0.22%) |
9.09 |
9.08 - 9.12 |
0.891 times |
Fri 15 August 2025 |
9.09 (-0.22%) |
9.11 |
9.06 - 9.12 |
1.6591 times |
Fri 08 August 2025 |
9.11 (0%) |
9.11 |
9.10 - 9.12 |
0.6312 times |
Fri 01 August 2025 |
9.11 (-0.11%) |
9.12 |
9.10 - 9.12 |
0.6803 times |
Fri 25 July 2025 |
9.12 (0.22%) |
9.11 |
9.10 - 9.13 |
0.655 times |
Fri 18 July 2025 |
9.10 (-0.11%) |
9.12 |
9.09 - 9.12 |
1.3731 times |
Fri 11 July 2025 |
9.11 (0.11%) |
9.10 |
9.10 - 9.12 |
0.6315 times |
Thu 03 July 2025 |
9.10 (0.22%) |
9.08 |
9.08 - 9.12 |
1.1925 times |
Fri 27 June 2025 |
9.08 (0.11%) |
9.08 |
9.07 - 9.09 |
1.0518 times |
Fri 20 June 2025 |
9.07 (0.33%) |
9.07 |
9.06 - 9.08 |
1.3911 times |
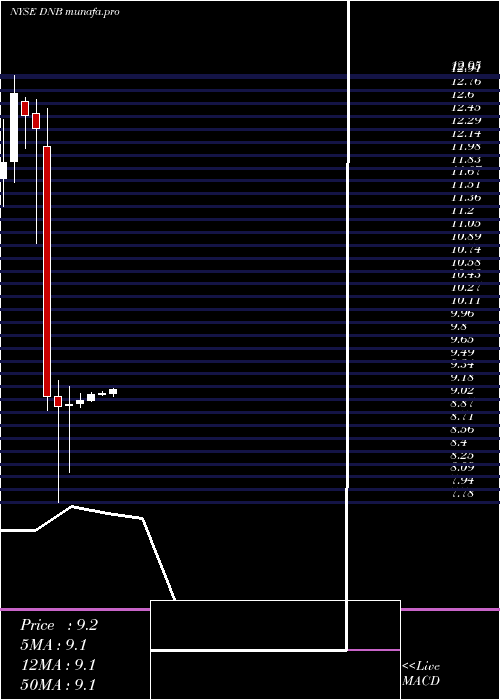
Monthly price and charts DunBradstreet Strong monthly Stock price targets for DunBradstreet DNB are 9.11 and 9.21 | Monthly Target 1 | 9.02 | | Monthly Target 2 | 9.09 | | Monthly Target 3 | 9.1233333333333 | | Monthly Target 4 | 9.19 | | Monthly Target 5 | 9.22 |
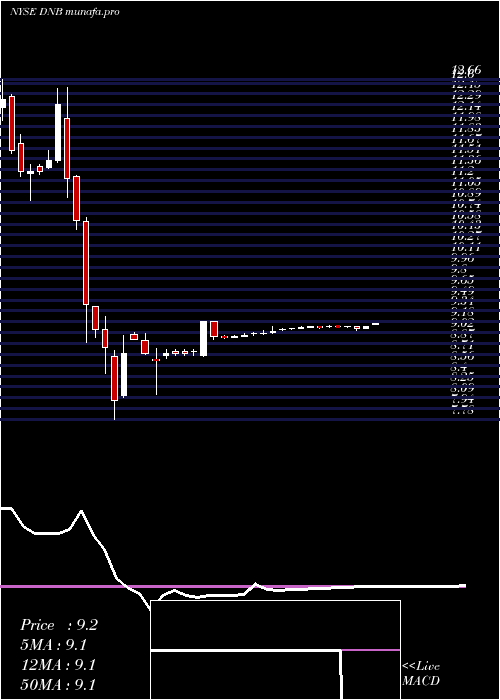
Monthly price and volumes Dun Bradstreet
| Date |
Closing |
Open |
Range |
Volume |
Mon 25 August 2025 |
9.15 (0.55%) |
9.10 |
9.06 - 9.16 |
0.5006 times |
Thu 31 July 2025 |
9.10 (0.11%) |
9.09 |
9.08 - 9.13 |
0.4524 times |
Mon 30 June 2025 |
9.09 (0.89%) |
9.01 |
9.00 - 9.11 |
0.823 times |
Fri 30 May 2025 |
9.01 (0.45%) |
8.98 |
8.93 - 9.10 |
1.4947 times |
Wed 30 April 2025 |
8.97 (0.34%) |
8.96 |
8.14 - 9.19 |
3.4997 times |
Mon 31 March 2025 |
8.94 (-1.43%) |
9.07 |
7.78 - 9.26 |
1.2914 times |
Fri 28 February 2025 |
9.07 (-26.26%) |
12.09 |
8.89 - 12.54 |
0.6759 times |
Fri 31 January 2025 |
12.30 (-1.28%) |
12.48 |
10.92 - 12.66 |
0.5725 times |
Tue 31 December 2024 |
12.46 (-2.12%) |
12.63 |
12.06 - 12.68 |
0.2587 times |
Tue 26 November 2024 |
12.73 (7.06%) |
11.90 |
11.65 - 12.95 |
0.4312 times |
Thu 31 October 2024 |
11.89 (3.3%) |
11.57 |
10.75 - 12.41 |
0.4353 times |
DMA SMA EMA moving averages of Dun Bradstreet DNB
DMA (daily moving average) of Dun Bradstreet DNB
| DMA period | DMA value | | 5 day DMA | 9.11 | | 12 day DMA | 9.11 | | 20 day DMA | 9.11 | | 35 day DMA | 9.11 | | 50 day DMA | 9.1 | | 100 day DMA | 9 | | 150 day DMA | 9.33 | | 200 day DMA | 10.04 | EMA (exponential moving average) of Dun Bradstreet DNB
| EMA period | EMA current | EMA prev | EMA prev2 | | 5 day EMA | 9.12 | 9.1 | 9.1 | | 12 day EMA | 9.11 | 9.1 | 9.1 | | 20 day EMA | 9.09 | 9.08 | 9.08 | | 35 day EMA | 9.09 | 9.09 | 9.09 | | 50 day EMA | 9.09 | 9.09 | 9.09 |
SMA (simple moving average) of Dun Bradstreet DNB
| SMA period | SMA current | SMA prev | SMA prev2 | | 5 day SMA | 9.11 | 9.1 | 9.1 | | 12 day SMA | 9.11 | 9.1 | 9.1 | | 20 day SMA | 9.11 | 9.1 | 9.1 | | 35 day SMA | 9.11 | 9.11 | 9.11 | | 50 day SMA | 9.1 | 9.1 | 9.1 | | 100 day SMA | 9 | 9 | 9 | | 150 day SMA | 9.33 | 9.35 | 9.36 | | 200 day SMA | 10.04 | 10.05 | 10.06 |
|
|
