CivitasSolutions CIVI full analysis,charts,indicators,moving averages,SMA,DMA,EMA,ADX,MACD,RSICivitas Solutions CIVI WideScreen charts, DMA,SMA,EMA technical analysis, forecast prediction, by indicators ADX,MACD,RSI,CCI NYSE stock exchange
operates under Health Care sector & deals in Medical Nursing Services
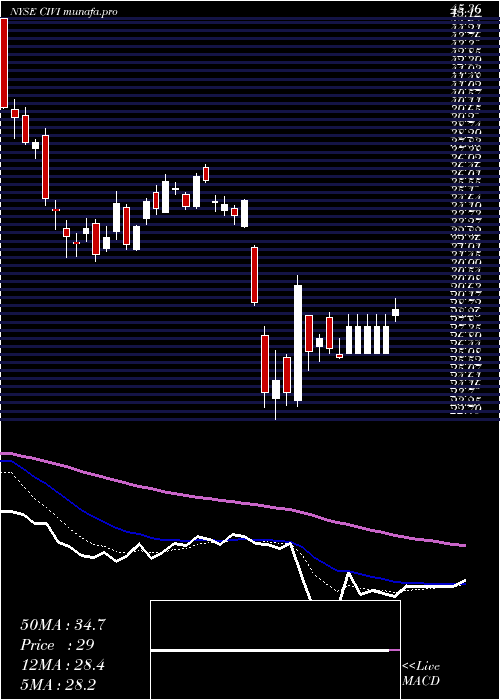
Daily price and charts and targets CivitasSolutions Strong Daily Stock price targets for CivitasSolutions CIVI are 26.92 and 28.37 | Daily Target 1 | 25.83 | | Daily Target 2 | 26.55 | | Daily Target 3 | 27.276666666667 | | Daily Target 4 | 28 | | Daily Target 5 | 28.73 |
Daily price and volume Civitas Solutions
| Date |
Closing |
Open |
Range |
Volume |
Fri 07 November 2025 |
27.28 (3.53%) |
27.00 |
26.55 - 28.00 |
1.3216 times |
Thu 06 November 2025 |
26.35 (2.09%) |
26.34 |
25.98 - 26.84 |
1.2885 times |
Wed 05 November 2025 |
25.81 (-4.37%) |
27.00 |
25.77 - 27.73 |
2.1727 times |
Tue 04 November 2025 |
26.99 (-6.38%) |
27.16 |
26.55 - 27.70 |
1.4772 times |
Fri 31 October 2025 |
28.83 (0%) |
28.86 |
28.48 - 29.23 |
0.5254 times |
Fri 31 October 2025 |
28.83 (0.38%) |
28.86 |
28.48 - 29.23 |
0.5254 times |
Thu 30 October 2025 |
28.72 (-0.14%) |
28.39 |
28.25 - 29.29 |
0.665 times |
Wed 29 October 2025 |
28.76 (1.88%) |
28.25 |
28.25 - 29.15 |
0.7543 times |
Tue 28 October 2025 |
28.23 (-1.22%) |
28.24 |
27.85 - 28.64 |
0.7002 times |
Mon 27 October 2025 |
28.58 (0.14%) |
29.03 |
28.53 - 29.48 |
0.5696 times |
Fri 24 October 2025 |
28.54 (-2.13%) |
29.29 |
28.51 - 29.46 |
0.5237 times |
Weekly price and charts CivitasSolutions Strong weekly Stock price targets for CivitasSolutions CIVI are 26.53 and 28.76 | Weekly Target 1 | 24.79 | | Weekly Target 2 | 26.03 | | Weekly Target 3 | 27.016666666667 | | Weekly Target 4 | 28.26 | | Weekly Target 5 | 29.25 |
Weekly price and volumes for Civitas Solutions
| Date |
Closing |
Open |
Range |
Volume |
Fri 07 November 2025 |
27.28 (-5.38%) |
27.16 |
25.77 - 28.00 |
1.1949 times |
Fri 31 October 2025 |
28.83 (0%) |
28.86 |
28.48 - 29.23 |
0.1003 times |
Fri 31 October 2025 |
28.83 (1.02%) |
29.03 |
27.85 - 29.48 |
0.6136 times |
Fri 24 October 2025 |
28.54 (3.18%) |
27.77 |
26.76 - 29.46 |
0.7623 times |
Fri 17 October 2025 |
27.66 (-6.17%) |
29.82 |
27.37 - 31.22 |
0.9705 times |
Fri 10 October 2025 |
29.48 (-15.46%) |
35.33 |
29.42 - 35.51 |
1.1604 times |
Fri 03 October 2025 |
34.87 (4.75%) |
32.80 |
30.51 - 35.78 |
1.5695 times |
Fri 26 September 2025 |
33.29 (8.08%) |
30.81 |
30.70 - 34.90 |
1.1322 times |
Fri 19 September 2025 |
30.80 (-5.58%) |
32.59 |
30.46 - 33.69 |
1.2714 times |
Fri 12 September 2025 |
32.62 (-5.15%) |
34.54 |
32.44 - 34.81 |
1.225 times |
Fri 05 September 2025 |
34.39 (-6.5%) |
36.55 |
33.83 - 37.45 |
1.331 times |

Monthly price and charts CivitasSolutions Strong monthly Stock price targets for CivitasSolutions CIVI are 26.53 and 28.76 | Monthly Target 1 | 24.79 | | Monthly Target 2 | 26.03 | | Monthly Target 3 | 27.016666666667 | | Monthly Target 4 | 28.26 | | Monthly Target 5 | 29.25 |
Monthly price and volumes Civitas Solutions
| Date |
Closing |
Open |
Range |
Volume |
Fri 07 November 2025 |
27.28 (-5.38%) |
27.16 |
25.77 - 28.00 |
0.2849 times |
Fri 31 October 2025 |
28.83 (-11.29%) |
32.12 |
26.76 - 35.78 |
1.0571 times |
Tue 30 September 2025 |
32.50 (-11.64%) |
36.55 |
30.46 - 37.45 |
1.3594 times |
Fri 29 August 2025 |
36.78 (21.15%) |
29.98 |
27.68 - 37.26 |
1.3955 times |
Thu 31 July 2025 |
30.36 (10.32%) |
27.77 |
27.42 - 33.12 |
0.848 times |
Mon 30 June 2025 |
27.52 (0.55%) |
28.85 |
26.80 - 34.25 |
1.1593 times |
Fri 30 May 2025 |
27.37 (0.44%) |
27.20 |
25.86 - 32.14 |
0.8944 times |
Wed 30 April 2025 |
27.25 (-21.9%) |
34.65 |
22.79 - 35.13 |
1.2027 times |
Mon 31 March 2025 |
34.89 (-9%) |
38.75 |
31.69 - 39.14 |
0.9681 times |
Fri 28 February 2025 |
38.34 (-24.47%) |
50.41 |
37.49 - 52.22 |
0.8307 times |
Fri 31 January 2025 |
50.76 (10.66%) |
46.74 |
46.61 - 55.35 |
0.6085 times |

DMA SMA EMA moving averages of Civitas Solutions CIVI
DMA (daily moving average) of Civitas Solutions CIVI
| DMA period | DMA value | | 5 day DMA | 27.05 | | 12 day DMA | 28.01 | | 20 day DMA | 28.1 | | 35 day DMA | 30.32 | | 50 day DMA | 31.33 | | 100 day DMA | 31.25 | | 150 day DMA | 30.41 | | 200 day DMA | 32.99 | EMA (exponential moving average) of Civitas Solutions CIVI
| EMA period | EMA current | EMA prev | EMA prev2 | | 5 day EMA | 27.11 | 27.02 | 27.36 | | 12 day EMA | 27.78 | 27.87 | 28.15 | | 20 day EMA | 28.55 | 28.68 | 28.92 | | 35 day EMA | 29.78 | 29.93 | 30.14 | | 50 day EMA | 31.24 | 31.4 | 31.61 |
SMA (simple moving average) of Civitas Solutions CIVI
| SMA period | SMA current | SMA prev | SMA prev2 | | 5 day SMA | 27.05 | 27.36 | 27.84 | | 12 day SMA | 28.01 | 28.01 | 28.1 | | 20 day SMA | 28.1 | 28.21 | 28.54 | | 35 day SMA | 30.32 | 30.42 | 30.58 | | 50 day SMA | 31.33 | 31.52 | 31.71 | | 100 day SMA | 31.25 | 31.31 | 31.38 | | 150 day SMA | 30.41 | 30.39 | 30.38 | | 200 day SMA | 32.99 | 33.12 | 33.25 |
|
|
