BestInc BEST full analysis,charts,indicators,moving averages,SMA,DMA,EMA,ADX,MACD,RSIBest Inc BEST WideScreen charts, DMA,SMA,EMA technical analysis, forecast prediction, by indicators ADX,MACD,RSI,CCI NYSE stock exchange
operates under Transportation sector & deals in Trucking Freight Courier Services
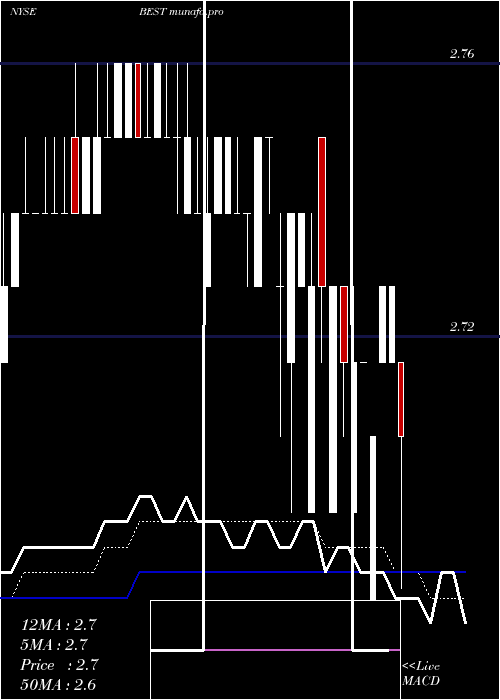
Daily price and charts and targets BestInc Strong Daily Stock price targets for BestInc BEST are 2.69 and 2.72 | Daily Target 1 | 2.68 | | Daily Target 2 | 2.69 | | Daily Target 3 | 2.7066666666667 | | Daily Target 4 | 2.72 | | Daily Target 5 | 2.74 |
Daily price and volume Best Inc
| Date |
Closing |
Open |
Range |
Volume |
Thu 17 October 2024 |
2.71 (-0.73%) |
2.72 |
2.69 - 2.72 |
0.241 times |
Wed 16 October 2024 |
2.73 (0%) |
2.72 |
2.72 - 2.73 |
0.2582 times |
Tue 15 October 2024 |
2.73 (0.74%) |
2.72 |
2.72 - 2.73 |
0.4819 times |
Mon 14 October 2024 |
2.71 (-0.37%) |
2.67 |
2.67 - 2.71 |
0.3356 times |
Fri 11 October 2024 |
2.72 (0%) |
2.72 |
2.72 - 2.72 |
0.2582 times |
Thu 10 October 2024 |
2.72 (0%) |
2.70 |
2.70 - 2.73 |
0.7143 times |
Wed 09 October 2024 |
2.72 (-0.37%) |
2.73 |
2.71 - 2.73 |
1.6437 times |
Tue 08 October 2024 |
2.73 (0%) |
2.70 |
2.70 - 2.73 |
3.3735 times |
Mon 07 October 2024 |
2.73 (0%) |
2.75 |
2.72 - 2.75 |
2.3838 times |
Fri 04 October 2024 |
2.73 (-0.36%) |
2.70 |
2.70 - 2.74 |
0.3098 times |
Thu 03 October 2024 |
2.74 (0%) |
2.73 |
2.73 - 2.74 |
0.9811 times |
Weekly price and charts BestInc Strong weekly Stock price targets for BestInc BEST are 2.69 and 2.75 | Weekly Target 1 | 2.64 | | Weekly Target 2 | 2.68 | | Weekly Target 3 | 2.7033333333333 | | Weekly Target 4 | 2.74 | | Weekly Target 5 | 2.76 |
Weekly price and volumes for Best Inc
| Date |
Closing |
Open |
Range |
Volume |
Thu 17 October 2024 |
2.71 (-0.37%) |
2.67 |
2.67 - 2.73 |
0.1872 times |
Fri 11 October 2024 |
2.72 (-0.37%) |
2.75 |
2.70 - 2.75 |
1.1908 times |
Fri 04 October 2024 |
2.73 (-0.73%) |
2.75 |
2.70 - 2.75 |
1.5775 times |
Fri 27 September 2024 |
2.75 (0.36%) |
2.74 |
2.73 - 2.75 |
1.6461 times |
Fri 20 September 2024 |
2.74 (-0.72%) |
2.75 |
2.73 - 2.76 |
0.6229 times |
Fri 13 September 2024 |
2.76 (0.36%) |
2.75 |
2.75 - 2.76 |
0.6095 times |
Fri 06 September 2024 |
2.75 (0.36%) |
2.75 |
2.74 - 2.76 |
1.9337 times |
Fri 30 August 2024 |
2.74 (0%) |
2.74 |
2.74 - 2.75 |
0.1163 times |
Fri 30 August 2024 |
2.74 (0.37%) |
2.73 |
2.73 - 2.75 |
0.9766 times |
Fri 23 August 2024 |
2.73 (0.37%) |
2.72 |
2.71 - 2.74 |
1.1394 times |
Fri 16 August 2024 |
2.72 (-0.37%) |
2.72 |
2.67 - 2.72 |
3.2505 times |

Monthly price and charts BestInc Strong monthly Stock price targets for BestInc BEST are 2.65 and 2.73 | Monthly Target 1 | 2.63 | | Monthly Target 2 | 2.67 | | Monthly Target 3 | 2.71 | | Monthly Target 4 | 2.75 | | Monthly Target 5 | 2.79 |
Monthly price and volumes Best Inc
| Date |
Closing |
Open |
Range |
Volume |
Thu 17 October 2024 |
2.71 (-1.45%) |
2.73 |
2.67 - 2.75 |
0.4042 times |
Mon 30 September 2024 |
2.75 (0.36%) |
2.75 |
2.73 - 2.76 |
0.9589 times |
Fri 30 August 2024 |
2.74 (-0.36%) |
2.74 |
2.66 - 2.75 |
1.3466 times |
Wed 31 July 2024 |
2.75 (0%) |
2.75 |
2.72 - 2.75 |
1.274 times |
Fri 28 June 2024 |
2.75 (37.5%) |
2.02 |
2.00 - 2.77 |
2.6383 times |
Fri 31 May 2024 |
2.00 (-5.21%) |
2.11 |
1.85 - 2.13 |
0.9225 times |
Tue 30 April 2024 |
2.11 (-4.09%) |
2.17 |
2.05 - 2.30 |
0.4506 times |
Thu 28 March 2024 |
2.20 (4.27%) |
2.05 |
2.03 - 2.38 |
0.436 times |
Thu 29 February 2024 |
2.11 (-9.05%) |
2.45 |
1.99 - 2.46 |
0.5693 times |
Wed 31 January 2024 |
2.32 (-9.02%) |
2.53 |
2.01 - 2.60 |
0.9997 times |
Fri 29 December 2023 |
2.55 (7.14%) |
2.34 |
2.33 - 2.60 |
1.1496 times |

DMA SMA EMA moving averages of Best Inc BEST
DMA (daily moving average) of Best Inc BEST
| DMA period | DMA value | | 5 day DMA | 2.72 | | 12 day DMA | 2.73 | | 20 day DMA | 2.73 | | 35 day DMA | 2.74 | | 50 day DMA | 2.74 | | 100 day DMA | 2.66 | | 150 day DMA | 2.48 | | 200 day DMA | 2.43 | EMA (exponential moving average) of Best Inc BEST
| EMA period | EMA current | EMA prev | EMA prev2 | | 5 day EMA | 2.72 | 2.72 | 2.72 | | 12 day EMA | 2.73 | 2.73 | 2.73 | | 20 day EMA | 2.73 | 2.73 | 2.73 | | 35 day EMA | 2.74 | 2.74 | 2.74 | | 50 day EMA | 2.74 | 2.74 | 2.74 |
SMA (simple moving average) of Best Inc BEST
| SMA period | SMA current | SMA prev | SMA prev2 | | 5 day SMA | 2.72 | 2.72 | 2.72 | | 12 day SMA | 2.73 | 2.73 | 2.73 | | 20 day SMA | 2.73 | 2.73 | 2.74 | | 35 day SMA | 2.74 | 2.74 | 2.74 | | 50 day SMA | 2.74 | 2.74 | 2.74 | | 100 day SMA | 2.66 | 2.66 | 2.65 | | 150 day SMA | 2.48 | 2.48 | 2.47 | | 200 day SMA | 2.43 | 2.43 | 2.42 |
|
|
