WalchandnagarIndustries WALCHANNAG_BE full analysis,charts,indicators,moving averages,SMA,DMA,EMA,ADX,MACD,RSIWalchandnagar Industries WALCHANNAG_BE WideScreen charts, DMA,SMA,EMA technical analysis, forecast prediction, by indicators ADX,MACD,RSI,CCI NSE stock exchange
Daily price and charts and targets WalchandnagarIndustries Strong Daily Stock price targets for WalchandnagarIndustries WALCHANNAG_BE are 169.69 and 177.84 | Daily Target 1 | 168.16 | | Daily Target 2 | 171.21 | | Daily Target 3 | 176.30666666667 | | Daily Target 4 | 179.36 | | Daily Target 5 | 184.46 |
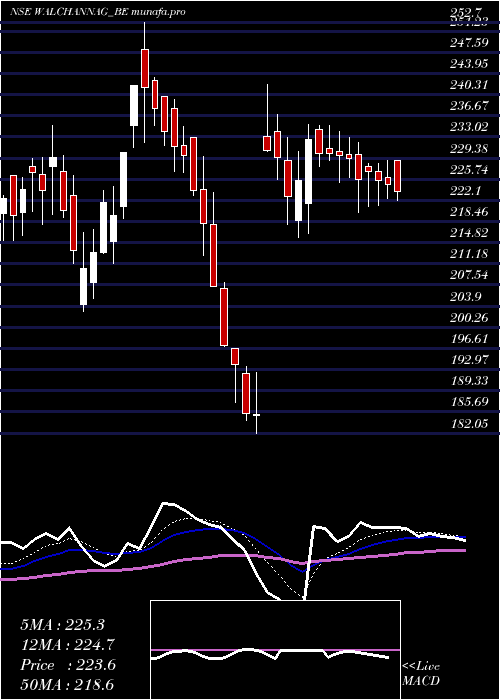
Daily price and volume Walchandnagar Industries
| Date |
Closing |
Open |
Range |
Volume |
Fri 29 August 2025 |
174.27 (-0.51%) |
175.20 |
173.25 - 181.40 |
1.0045 times |
Thu 28 August 2025 |
175.16 (-0.59%) |
176.10 |
173.35 - 179.99 |
0.7749 times |
Tue 26 August 2025 |
176.20 (-4.02%) |
183.85 |
175.00 - 183.85 |
1.6219 times |
Mon 25 August 2025 |
183.58 (-0.87%) |
184.30 |
182.70 - 189.50 |
0.6885 times |
Fri 22 August 2025 |
185.19 (-0.85%) |
186.00 |
182.10 - 188.65 |
0.7305 times |
Thu 21 August 2025 |
186.77 (0.54%) |
185.77 |
184.50 - 188.95 |
0.6769 times |
Wed 20 August 2025 |
185.77 (1.1%) |
184.70 |
182.50 - 187.80 |
0.8676 times |
Tue 19 August 2025 |
183.75 (3.09%) |
178.99 |
176.00 - 185.80 |
1.0587 times |
Mon 18 August 2025 |
178.24 (-1.97%) |
180.00 |
172.73 - 184.00 |
2.0535 times |
Thu 14 August 2025 |
181.83 (-2.07%) |
187.50 |
180.20 - 187.50 |
0.5229 times |
Wed 13 August 2025 |
185.68 (0.66%) |
185.25 |
184.35 - 189.50 |
0.6077 times |
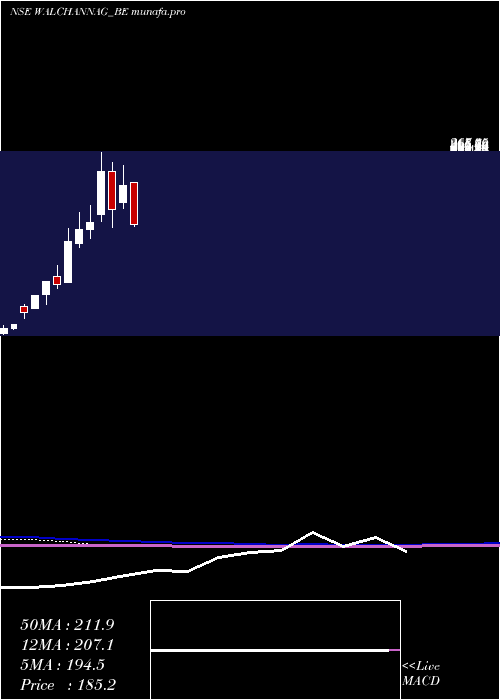
Weekly price and charts WalchandnagarIndustries Strong weekly Stock price targets for WalchandnagarIndustries WALCHANNAG_BE are 165.64 and 181.89 | Weekly Target 1 | 162.76 | | Weekly Target 2 | 168.51 | | Weekly Target 3 | 179.00666666667 | | Weekly Target 4 | 184.76 | | Weekly Target 5 | 195.26 |
Weekly price and volumes for Walchandnagar Industries
| Date |
Closing |
Open |
Range |
Volume |
Fri 29 August 2025 |
174.27 (-5.9%) |
184.30 |
173.25 - 189.50 |
0.5823 times |
Fri 22 August 2025 |
185.19 (1.85%) |
180.00 |
172.73 - 188.95 |
0.767 times |
Thu 14 August 2025 |
181.83 (-0.37%) |
184.00 |
177.00 - 189.90 |
0.6094 times |
Fri 08 August 2025 |
182.51 (-5.93%) |
195.00 |
182.00 - 197.00 |
0.6285 times |
Fri 01 August 2025 |
194.02 (-5.54%) |
206.90 |
193.00 - 208.00 |
0.861 times |
Fri 25 July 2025 |
205.40 (-4.29%) |
212.15 |
200.00 - 218.00 |
1.1547 times |
Fri 18 July 2025 |
214.60 (1.16%) |
210.10 |
203.00 - 225.81 |
1.7787 times |
Fri 11 July 2025 |
212.13 (-5.13%) |
226.70 |
209.55 - 227.00 |
1.0357 times |
Fri 04 July 2025 |
223.61 (-2.5%) |
229.95 |
220.05 - 232.00 |
0.9476 times |
Fri 27 June 2025 |
229.35 (1.71%) |
221.51 |
216.32 - 235.17 |
1.6351 times |
Fri 20 June 2025 |
225.49 (21.75%) |
233.00 |
215.65 - 242.10 |
1.5202 times |
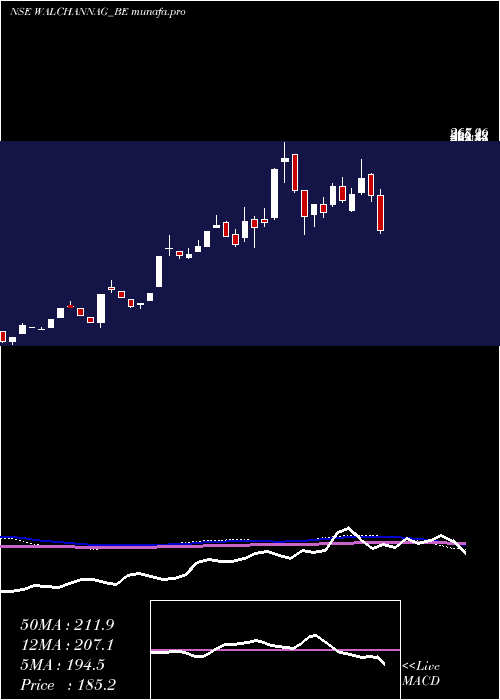
Monthly price and charts WalchandnagarIndustries Strong monthly Stock price targets for WalchandnagarIndustries WALCHANNAG_BE are 159.12 and 187.89 | Monthly Target 1 | 154.06 | | Monthly Target 2 | 164.17 | | Monthly Target 3 | 182.83333333333 | | Monthly Target 4 | 192.94 | | Monthly Target 5 | 211.6 |
Monthly price and volumes Walchandnagar Industries
| Date |
Closing |
Open |
Range |
Volume |
Fri 29 August 2025 |
174.27 (-12.42%) |
197.25 |
172.73 - 201.50 |
0.5276 times |
Thu 31 July 2025 |
198.99 (-11.8%) |
227.88 |
193.00 - 229.00 |
1.0429 times |
Mon 30 June 2025 |
225.62 (21.83%) |
233.00 |
215.65 - 242.10 |
0.6667 times |
Fri 10 May 2024 |
185.20 (-19.39%) |
232.95 |
182.05 - 232.95 |
0.645 times |
Tue 30 April 2024 |
229.75 (13.57%) |
209.90 |
202.90 - 252.70 |
1.1106 times |
Thu 28 March 2024 |
202.30 (-17.91%) |
245.95 |
181.65 - 256.70 |
1.0354 times |
Thu 29 February 2024 |
246.45 (31.37%) |
195.90 |
188.50 - 268.10 |
1.459 times |
Fri 22 December 2023 |
187.60 (4.43%) |
179.00 |
168.45 - 206.90 |
0.9063 times |
Thu 30 November 2023 |
179.65 (8.62%) |
163.00 |
158.85 - 198.95 |
0.6611 times |
Tue 31 October 2023 |
165.40 (42.34%) |
118.50 |
118.50 - 180.15 |
1.9454 times |
Fri 29 September 2023 |
116.20 (-2.27%) |
124.80 |
110.85 - 137.55 |
1.8867 times |
DMA SMA EMA moving averages of Walchandnagar Industries WALCHANNAG_BE
DMA (daily moving average) of Walchandnagar Industries WALCHANNAG_BE
| DMA period | DMA value | | 5 day DMA | 178.88 | | 12 day DMA | 181.74 | | 20 day DMA | 184.36 | | 35 day DMA | 195.13 | | 50 day DMA | 203.99 | | 100 day DMA | 211.06 | | 150 day DMA | 203.44 | | 200 day DMA | 184.72 | EMA (exponential moving average) of Walchandnagar Industries WALCHANNAG_BE
| EMA period | EMA current | EMA prev | EMA prev2 | | 5 day EMA | 177.77 | 179.52 | 181.7 | | 12 day EMA | 181.64 | 182.98 | 184.4 | | 20 day EMA | 185.78 | 186.99 | 188.24 | | 35 day EMA | 193.25 | 194.37 | 195.5 | | 50 day EMA | 201.53 | 202.64 | 203.76 |
SMA (simple moving average) of Walchandnagar Industries WALCHANNAG_BE
| SMA period | SMA current | SMA prev | SMA prev2 | | 5 day SMA | 178.88 | 181.38 | 183.5 | | 12 day SMA | 181.74 | 182.52 | 183.13 | | 20 day SMA | 184.36 | 185.75 | 186.99 | | 35 day SMA | 195.13 | 196.32 | 197.36 | | 50 day SMA | 203.99 | 205.09 | 206.2 | | 100 day SMA | 211.06 | 211.94 | 212.74 | | 150 day SMA | 203.44 | 203.36 | 203.24 | | 200 day SMA | 184.72 | 184.4 | 184.09 |
|
|
