VertexplusTechnologies VERTEXPLUS_ST full analysis,charts,indicators,moving averages,SMA,DMA,EMA,ADX,MACD,RSIVertexplus Technologies VERTEXPLUS_ST WideScreen charts, DMA,SMA,EMA technical analysis, forecast prediction, by indicators ADX,MACD,RSI,CCI NSE stock exchange
Daily price and charts and targets VertexplusTechnologies Strong Daily Stock price targets for VertexplusTechnologies VERTEXPLUS_ST are 114.93 and 126.38 | Daily Target 1 | 105.38 | | Daily Target 2 | 113.02 | | Daily Target 3 | 116.83333333333 | | Daily Target 4 | 124.47 | | Daily Target 5 | 128.28 |
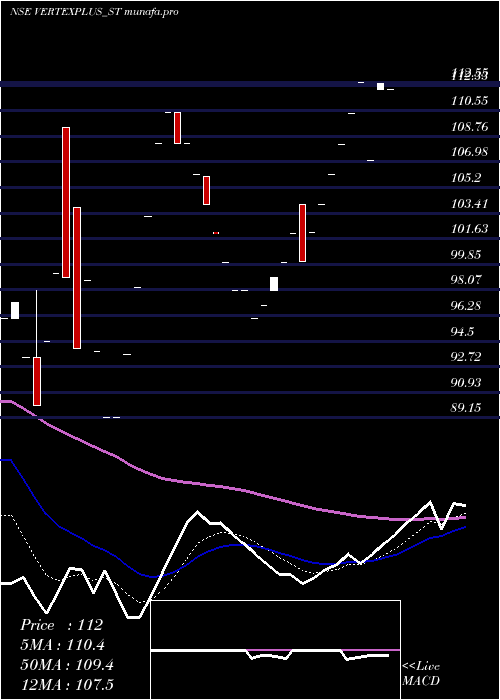
Daily price and volume Vertexplus Technologies
| Date |
Closing |
Open |
Range |
Volume |
Tue 04 November 2025 |
120.65 (4.96%) |
109.70 |
109.20 - 120.65 |
1.7619 times |
Mon 03 November 2025 |
114.95 (4.5%) |
104.50 |
104.50 - 114.95 |
2.3333 times |
Fri 31 October 2025 |
110.00 (-1.61%) |
106.25 |
106.25 - 110.00 |
0.0952 times |
Thu 30 October 2025 |
111.80 (-4.97%) |
111.80 |
111.80 - 111.80 |
0.0476 times |
Wed 29 October 2025 |
117.65 (-4.97%) |
121.50 |
117.65 - 121.50 |
0.619 times |
Tue 28 October 2025 |
123.80 (-4.99%) |
123.80 |
123.80 - 123.80 |
0.0476 times |
Fri 17 October 2025 |
130.30 (-4.99%) |
130.30 |
130.30 - 130.30 |
0.0476 times |
Wed 15 October 2025 |
137.15 (0.99%) |
142.55 |
137.15 - 142.55 |
0.0952 times |
Wed 08 October 2025 |
135.80 (-5%) |
149.80 |
135.80 - 149.80 |
0.7619 times |
Tue 07 October 2025 |
142.95 (3.59%) |
144.90 |
142.90 - 144.90 |
4.1905 times |
Mon 06 October 2025 |
138.00 (4.98%) |
138.00 |
138.00 - 138.00 |
0.1429 times |
Weekly price and charts VertexplusTechnologies Strong weekly Stock price targets for VertexplusTechnologies VERTEXPLUS_ST are 112.58 and 128.73 | Weekly Target 1 | 99.12 | | Weekly Target 2 | 109.88 | | Weekly Target 3 | 115.26666666667 | | Weekly Target 4 | 126.03 | | Weekly Target 5 | 131.42 |
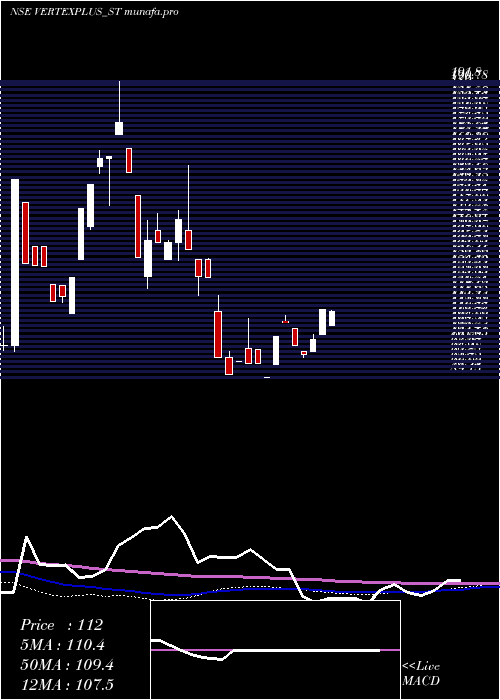
Weekly price and volumes for Vertexplus Technologies
| Date |
Closing |
Open |
Range |
Volume |
Tue 04 November 2025 |
120.65 (9.68%) |
104.50 |
104.50 - 120.65 |
3.221 times |
Fri 31 October 2025 |
110.00 (-15.58%) |
123.80 |
106.25 - 123.80 |
0.6367 times |
Fri 17 October 2025 |
130.30 (-4.05%) |
142.55 |
130.30 - 142.55 |
0.1124 times |
Wed 08 October 2025 |
135.80 (3.31%) |
138.00 |
135.80 - 149.80 |
4.0075 times |
Fri 03 October 2025 |
131.45 (4.99%) |
131.45 |
131.45 - 131.45 |
0.0375 times |
Fri 26 September 2025 |
125.20 (0%) |
125.20 |
125.20 - 125.20 |
0.0749 times |
Fri 19 September 2025 |
125.20 (14.65%) |
131.75 |
125.20 - 131.75 |
0.1498 times |
Fri 05 September 2025 |
109.20 (3.65%) |
100.10 |
90.35 - 109.20 |
1.3858 times |
Fri 29 August 2025 |
105.35 (-18.52%) |
122.85 |
105.35 - 122.85 |
0.3371 times |
Tue 19 August 2025 |
129.30 (-1.97%) |
129.30 |
129.30 - 129.30 |
0.0375 times |
Wed 06 August 2025 |
131.90 (-3.97%) |
136.00 |
131.90 - 136.00 |
0.1498 times |
Monthly price and charts VertexplusTechnologies Strong monthly Stock price targets for VertexplusTechnologies VERTEXPLUS_ST are 112.58 and 128.73 | Monthly Target 1 | 99.12 | | Monthly Target 2 | 109.88 | | Monthly Target 3 | 115.26666666667 | | Monthly Target 4 | 126.03 | | Monthly Target 5 | 131.42 |
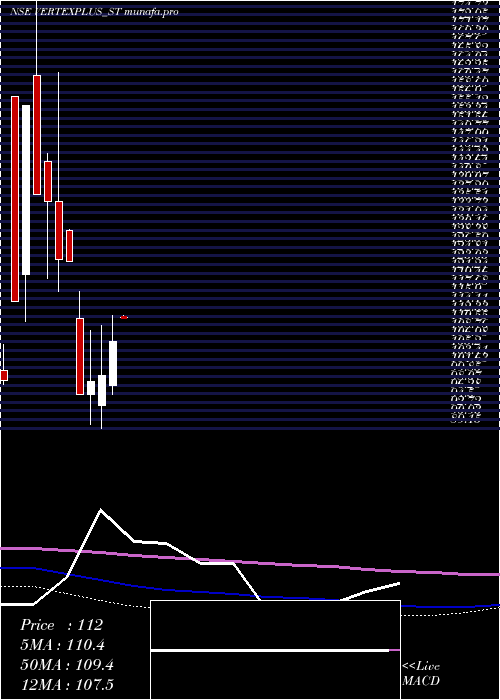
Monthly price and volumes Vertexplus Technologies
| Date |
Closing |
Open |
Range |
Volume |
Tue 04 November 2025 |
120.65 (9.68%) |
104.50 |
104.50 - 120.65 |
1.0683 times |
Fri 31 October 2025 |
110.00 (-12.14%) |
131.45 |
106.25 - 149.80 |
1.5901 times |
Fri 26 September 2025 |
125.20 (18.84%) |
100.10 |
90.35 - 131.75 |
0.5342 times |
Fri 29 August 2025 |
105.35 (-21.73%) |
131.90 |
105.35 - 131.90 |
0.1491 times |
Mon 21 July 2025 |
134.60 (25.68%) |
112.05 |
112.00 - 143.00 |
0.6211 times |
Mon 30 June 2025 |
107.10 (7.1%) |
98.00 |
96.05 - 112.55 |
0.323 times |
Fri 30 May 2025 |
100.00 (1.32%) |
93.80 |
89.15 - 110.45 |
0.3975 times |
Mon 28 April 2025 |
98.70 (2.76%) |
96.10 |
90.00 - 109.35 |
0.9068 times |
Fri 28 March 2025 |
96.05 (-22.35%) |
111.85 |
96.05 - 117.50 |
4.3602 times |
Thu 03 October 2024 |
123.70 (-0.24%) |
130.00 |
123.70 - 130.20 |
0.0497 times |
Thu 26 September 2024 |
124.00 (-8.82%) |
136.00 |
117.35 - 162.75 |
0.9938 times |
DMA SMA EMA moving averages of Vertexplus Technologies VERTEXPLUS_ST
DMA (daily moving average) of Vertexplus Technologies VERTEXPLUS_ST
| DMA period | DMA value | | 5 day DMA | 115.01 | | 12 day DMA | 126.21 | | 20 day DMA | 120.25 | | 35 day DMA | 123.55 | | 50 day DMA | 117.87 | | 100 day DMA | 117.24 | | 150 day DMA | 125.69 | | 200 day DMA | | EMA (exponential moving average) of Vertexplus Technologies VERTEXPLUS_ST
| EMA period | EMA current | EMA prev | EMA prev2 | | 5 day EMA | 118 | 116.68 | 117.55 | | 12 day EMA | 120.89 | 120.93 | 122.02 | | 20 day EMA | 121.28 | 121.35 | 122.02 | | 35 day EMA | 118.97 | 118.87 | 119.1 | | 50 day EMA | 116.16 | 115.98 | 116.02 |
SMA (simple moving average) of Vertexplus Technologies VERTEXPLUS_ST
| SMA period | SMA current | SMA prev | SMA prev2 | | 5 day SMA | 115.01 | 115.64 | 118.71 | | 12 day SMA | 126.21 | 126.59 | 127.44 | | 20 day SMA | 120.25 | 119.48 | 119.28 | | 35 day SMA | 123.55 | 123.31 | 123.24 | | 50 day SMA | 117.87 | 117.41 | 117.07 | | 100 day SMA | 117.24 | 117.27 | 117.43 | | 150 day SMA | 125.69 | 125.55 | 125.48 | | 200 day SMA |
|
|
