TemboGlobal TEMBO_BE full analysis,charts,indicators,moving averages,SMA,DMA,EMA,ADX,MACD,RSITembo Global TEMBO_BE WideScreen charts, DMA,SMA,EMA technical analysis, forecast prediction, by indicators ADX,MACD,RSI,CCI NSE stock exchange
Daily price and charts and targets TemboGlobal Strong Daily Stock price targets for TemboGlobal TEMBO_BE are 499.5 and 508.5 | Daily Target 1 | 498 | | Daily Target 2 | 501 | | Daily Target 3 | 507 | | Daily Target 4 | 510 | | Daily Target 5 | 516 |
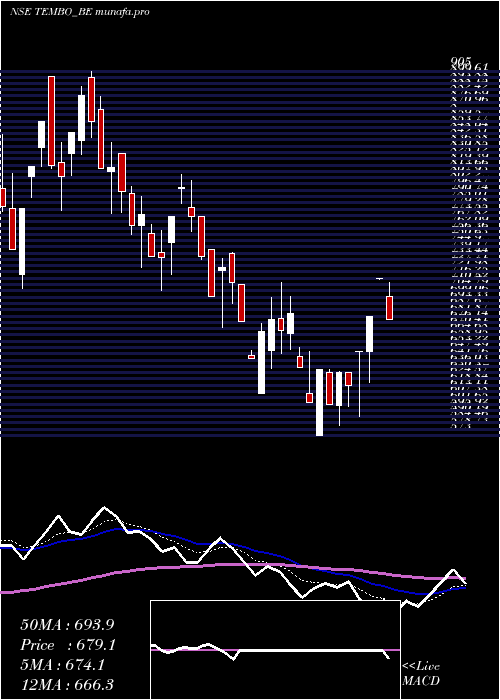
Daily price and volume Tembo Global
| Date |
Closing |
Open |
Range |
Volume |
Fri 11 July 2025 |
504.00 (0.05%) |
513.00 |
504.00 - 513.00 |
0.9645 times |
Thu 10 July 2025 |
503.75 (-1.99%) |
510.00 |
503.75 - 510.00 |
0.8036 times |
Wed 09 July 2025 |
514.00 (-1.37%) |
531.00 |
514.00 - 531.00 |
0.8183 times |
Tue 08 July 2025 |
521.15 (2%) |
521.15 |
521.15 - 521.15 |
0.9128 times |
Mon 07 July 2025 |
510.95 (-1.99%) |
510.95 |
510.95 - 510.95 |
0.0948 times |
Fri 04 July 2025 |
521.35 (-1.99%) |
521.35 |
521.35 - 521.35 |
0.2646 times |
Thu 03 July 2025 |
531.95 (-2%) |
531.95 |
531.95 - 531.95 |
0.3062 times |
Wed 02 July 2025 |
542.80 (-3.05%) |
550.50 |
531.90 - 559.00 |
1.3958 times |
Tue 01 July 2025 |
559.90 (1.76%) |
577.70 |
526.05 - 577.70 |
3.4357 times |
Mon 30 June 2025 |
550.20 (5%) |
537.00 |
530.00 - 550.20 |
1.0036 times |
Fri 27 June 2025 |
524.00 (5%) |
499.05 |
495.00 - 524.00 |
2.6321 times |
Weekly price and charts TemboGlobal Strong weekly Stock price targets for TemboGlobal TEMBO_BE are 490.25 and 517.5 | Weekly Target 1 | 485.67 | | Weekly Target 2 | 494.83 | | Weekly Target 3 | 512.91666666667 | | Weekly Target 4 | 522.08 | | Weekly Target 5 | 540.17 |
Weekly price and volumes for Tembo Global
| Date |
Closing |
Open |
Range |
Volume |
Fri 11 July 2025 |
504.00 (-3.33%) |
510.95 |
503.75 - 531.00 |
0.7828 times |
Fri 04 July 2025 |
521.35 (-0.51%) |
537.00 |
521.35 - 577.70 |
1.3953 times |
Fri 27 June 2025 |
524.00 (10.35%) |
455.20 |
455.20 - 524.00 |
1.5195 times |
Fri 20 June 2025 |
474.85 (-1.69%) |
480.00 |
462.05 - 480.00 |
0.4519 times |
Fri 13 June 2025 |
483.00 (2.68%) |
461.50 |
461.00 - 499.10 |
0.8719 times |
Fri 06 June 2025 |
470.40 (2.13%) |
469.80 |
469.80 - 481.05 |
0.5716 times |
Fri 30 May 2025 |
460.60 (-0.07%) |
451.70 |
442.70 - 479.25 |
1.424 times |
Fri 23 May 2025 |
460.90 (-9.61%) |
499.70 |
460.90 - 499.70 |
0.4203 times |
Fri 16 May 2025 |
509.90 (27.08%) |
414.00 |
405.70 - 509.90 |
1.5315 times |
Fri 09 May 2025 |
401.25 (-6.59%) |
429.55 |
386.00 - 455.00 |
1.0311 times |
Fri 02 May 2025 |
429.55 (-0.89%) |
422.00 |
405.05 - 438.60 |
1.1867 times |

Monthly price and charts TemboGlobal Strong monthly Stock price targets for TemboGlobal TEMBO_BE are 466.9 and 540.85 | Monthly Target 1 | 454.53 | | Monthly Target 2 | 479.27 | | Monthly Target 3 | 528.48333333333 | | Monthly Target 4 | 553.22 | | Monthly Target 5 | 602.43 |
Monthly price and volumes Tembo Global
| Date |
Closing |
Open |
Range |
Volume |
Fri 11 July 2025 |
504.00 (-8.4%) |
577.70 |
503.75 - 577.70 |
0.3118 times |
Mon 30 June 2025 |
550.20 (19.45%) |
469.80 |
455.20 - 550.20 |
0.5782 times |
Fri 30 May 2025 |
460.60 (10.26%) |
417.75 |
386.00 - 509.90 |
0.7572 times |
Wed 30 April 2025 |
417.75 (-18.86%) |
515.05 |
405.05 - 554.75 |
1.0979 times |
Fri 28 March 2025 |
514.85 (-12.66%) |
577.70 |
472.20 - 589.25 |
0.6289 times |
Fri 28 February 2025 |
589.45 (-13.89%) |
645.05 |
573.00 - 715.80 |
0.926 times |
Fri 31 January 2025 |
684.50 (-15.35%) |
829.95 |
610.85 - 905.00 |
1.7504 times |
Tue 31 December 2024 |
808.65 (16.29%) |
693.35 |
693.35 - 899.90 |
1.5222 times |
Fri 29 November 2024 |
695.35 (33.86%) |
545.40 |
545.40 - 744.10 |
1.5614 times |
Thu 31 October 2024 |
519.45 (-0.34%) |
510.80 |
461.80 - 519.45 |
0.866 times |
Mon 30 September 2024 |
521.20 (137.18%) |
227.00 |
208.80 - 531.80 |
2.753 times |

DMA SMA EMA moving averages of Tembo Global TEMBO_BE
DMA (daily moving average) of Tembo Global TEMBO_BE
| DMA period | DMA value | | 5 day DMA | 510.77 | | 12 day DMA | 523.59 | | 20 day DMA | 503.78 | | 35 day DMA | 490.32 | | 50 day DMA | 479.38 | | 100 day DMA | 507.13 | | 150 day DMA | 586.27 | | 200 day DMA | 579.53 | EMA (exponential moving average) of Tembo Global TEMBO_BE
| EMA period | EMA current | EMA prev | EMA prev2 | | 5 day EMA | 510.91 | 514.37 | 519.68 | | 12 day EMA | 512.17 | 513.66 | 515.46 | | 20 day EMA | 505.77 | 505.96 | 506.19 | | 35 day EMA | 492.56 | 491.89 | 491.19 | | 50 day EMA | 478.01 | 476.95 | 475.86 |
SMA (simple moving average) of Tembo Global TEMBO_BE
| SMA period | SMA current | SMA prev | SMA prev2 | | 5 day SMA | 510.77 | 514.24 | 519.88 | | 12 day SMA | 523.59 | 521.2 | 518.66 | | 20 day SMA | 503.78 | 502.73 | 501.55 | | 35 day SMA | 490.32 | 489.09 | 488.13 | | 50 day SMA | 479.38 | 477.9 | 476.18 | | 100 day SMA | 507.13 | 508.28 | 509.55 | | 150 day SMA | 586.27 | 587.54 | 588.91 | | 200 day SMA | 579.53 | 579.21 | 578.9 |
|
|
