Sonam SONAMLTD_BE full analysis,charts,indicators,moving averages,SMA,DMA,EMA,ADX,MACD,RSISonam SONAMLTD_BE WideScreen charts, DMA,SMA,EMA technical analysis, forecast prediction, by indicators ADX,MACD,RSI,CCI NSE stock exchange
Daily price and charts and targets Sonam Strong Daily Stock price targets for Sonam SONAMLTD_BE are 51.95 and 56.05 | Daily Target 1 | 48.9 | | Daily Target 2 | 50.89 | | Daily Target 3 | 52.996666666667 | | Daily Target 4 | 54.99 | | Daily Target 5 | 57.1 |
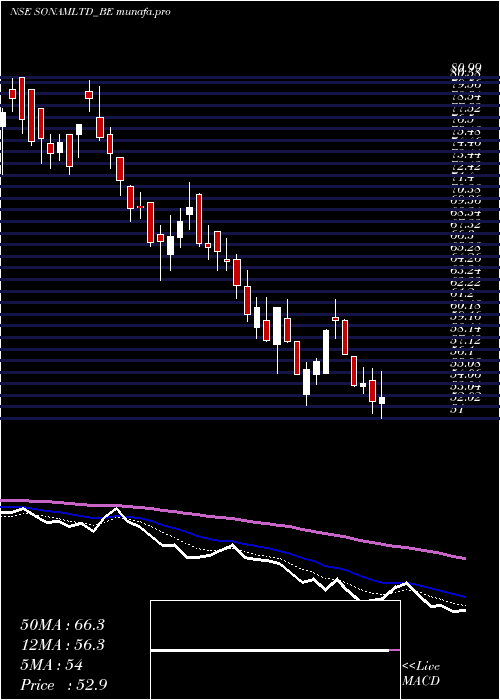
Daily price and volume Sonam
| Date |
Closing |
Open |
Range |
Volume |
Fri 31 January 2025 |
52.89 (0.74%) |
52.34 |
51.00 - 55.10 |
0.718 times |
Thu 30 January 2025 |
52.50 (-2.9%) |
54.32 |
51.41 - 55.45 |
0.6486 times |
Wed 29 January 2025 |
54.07 (0.37%) |
53.85 |
53.20 - 55.50 |
0.2748 times |
Tue 28 January 2025 |
53.87 (-4.94%) |
56.50 |
53.83 - 56.50 |
0.743 times |
Mon 27 January 2025 |
56.67 (-5.01%) |
59.66 |
56.67 - 59.70 |
0.5276 times |
Fri 24 January 2025 |
59.66 (1.57%) |
59.91 |
58.01 - 61.50 |
0.9811 times |
Thu 23 January 2025 |
58.74 (4.84%) |
55.01 |
55.01 - 58.83 |
1.0575 times |
Wed 22 January 2025 |
56.03 (1.23%) |
54.86 |
54.01 - 56.25 |
0.8484 times |
Tue 21 January 2025 |
55.35 (0.87%) |
53.15 |
52.12 - 55.97 |
2.1915 times |
Mon 20 January 2025 |
54.87 (-5%) |
57.75 |
54.87 - 57.75 |
2.0095 times |
Fri 17 January 2025 |
57.76 (-4.92%) |
59.79 |
57.71 - 61.49 |
1.5123 times |
Weekly price and charts Sonam Strong weekly Stock price targets for Sonam SONAMLTD_BE are 47.6 and 56.3 | Weekly Target 1 | 45.83 | | Weekly Target 2 | 49.36 | | Weekly Target 3 | 54.53 | | Weekly Target 4 | 58.06 | | Weekly Target 5 | 63.23 |
Weekly price and volumes for Sonam
| Date |
Closing |
Open |
Range |
Volume |
Fri 31 January 2025 |
52.89 (-11.35%) |
59.66 |
51.00 - 59.70 |
0.3086 times |
Fri 24 January 2025 |
59.66 (3.29%) |
57.75 |
52.12 - 61.50 |
0.7513 times |
Fri 17 January 2025 |
57.76 (-7.83%) |
62.64 |
54.97 - 64.00 |
1.1627 times |
Fri 10 January 2025 |
62.67 (-9.94%) |
70.70 |
61.59 - 70.80 |
0.7764 times |
Fri 03 January 2025 |
69.59 (0%) |
69.98 |
63.12 - 71.75 |
1.0079 times |
Fri 27 December 2024 |
69.59 (-8.11%) |
75.99 |
68.36 - 76.59 |
0.9947 times |
Fri 20 December 2024 |
75.73 (1.88%) |
74.40 |
72.50 - 80.70 |
1.6524 times |
Fri 13 December 2024 |
74.33 (-4.61%) |
79.95 |
73.00 - 80.99 |
0.5962 times |
Fri 06 December 2024 |
77.92 (2.22%) |
76.23 |
72.50 - 81.00 |
0.865 times |
Fri 29 November 2024 |
76.23 (-4.97%) |
78.00 |
75.31 - 86.45 |
1.8849 times |
Fri 22 November 2024 |
80.22 (-7.78%) |
85.25 |
80.22 - 85.25 |
0.1643 times |

Monthly price and charts Sonam Strong monthly Stock price targets for Sonam SONAMLTD_BE are 41.57 and 62.32 | Monthly Target 1 | 37.8 | | Monthly Target 2 | 45.34 | | Monthly Target 3 | 58.546666666667 | | Monthly Target 4 | 66.09 | | Monthly Target 5 | 79.3 |
Monthly price and volumes Sonam
| Date |
Closing |
Open |
Range |
Volume |
Fri 31 January 2025 |
52.89 (-20.53%) |
65.46 |
51.00 - 71.75 |
1.1025 times |
Tue 31 December 2024 |
66.55 (-12.7%) |
76.23 |
63.12 - 81.00 |
1.5285 times |
Fri 29 November 2024 |
76.23 (-12.59%) |
88.95 |
75.31 - 96.70 |
1.3458 times |
Thu 31 October 2024 |
87.21 (14.83%) |
75.95 |
67.32 - 87.21 |
3.7595 times |
Mon 30 September 2024 |
75.95 (3.76%) |
76.50 |
73.00 - 77.90 |
0.0858 times |
Thu 25 January 2024 |
73.20 (3.1%) |
72.00 |
66.50 - 74.85 |
0.0609 times |
Fri 29 December 2023 |
71.00 (-8.21%) |
78.00 |
70.25 - 82.40 |
0.0915 times |
Thu 30 November 2023 |
77.35 (0%) |
86.30 |
76.90 - 86.30 |
0.0254 times |
Mon 03 February 2025 |
(0%) |
|
- |
0 times |

DMA SMA EMA moving averages of Sonam SONAMLTD_BE
DMA (daily moving average) of Sonam SONAMLTD_BE
| DMA period | DMA value | | 5 day DMA | 54 | | 12 day DMA | 56.1 | | 20 day DMA | 58.88 | | 35 day DMA | 64.44 | | 50 day DMA | 68.58 | | 100 day DMA | 74.13 | | 150 day DMA | | | 200 day DMA | | EMA (exponential moving average) of Sonam SONAMLTD_BE
| EMA period | EMA current | EMA prev | EMA prev2 | | 5 day EMA | 54.02 | 54.59 | 55.64 | | 12 day EMA | 56.31 | 56.93 | 57.74 | | 20 day EMA | 58.95 | 59.59 | 60.34 | | 35 day EMA | 63.66 | 64.29 | 64.98 | | 50 day EMA | 68.48 | 69.12 | 69.8 |
SMA (simple moving average) of Sonam SONAMLTD_BE
| SMA period | SMA current | SMA prev | SMA prev2 | | 5 day SMA | 54 | 55.35 | 56.6 | | 12 day SMA | 56.1 | 56.51 | 57.2 | | 20 day SMA | 58.88 | 59.72 | 60.51 | | 35 day SMA | 64.44 | 65.09 | 65.75 | | 50 day SMA | 68.58 | 69.16 | 69.78 | | 100 day SMA | 74.13 | 74.32 | 74.52 | | 150 day SMA | | 200 day SMA |
|
|
