SolaraActive SOLARA_BE full analysis,charts,indicators,moving averages,SMA,DMA,EMA,ADX,MACD,RSISolara Active SOLARA_BE WideScreen charts, DMA,SMA,EMA technical analysis, forecast prediction, by indicators ADX,MACD,RSI,CCI NSE stock exchange
Daily price and charts and targets SolaraActive Strong Daily Stock price targets for SolaraActive SOLARA_BE are 698.23 and 743.38 | Daily Target 1 | 690.7 | | Daily Target 2 | 705.75 | | Daily Target 3 | 735.85 | | Daily Target 4 | 750.9 | | Daily Target 5 | 781 |
Daily price and volume Solara Active
| Date |
Closing |
Open |
Range |
Volume |
Mon 07 October 2024 |
720.80 (-5%) |
760.00 |
720.80 - 765.95 |
0.7905 times |
Fri 04 October 2024 |
758.70 (-2.05%) |
770.00 |
737.05 - 792.90 |
0.6235 times |
Thu 03 October 2024 |
774.60 (-1.89%) |
772.10 |
760.00 - 796.50 |
0.4784 times |
Tue 01 October 2024 |
789.50 (0.2%) |
799.90 |
783.00 - 827.00 |
0.2161 times |
Mon 30 September 2024 |
787.90 (-2.41%) |
810.00 |
770.10 - 818.00 |
0.6496 times |
Fri 27 September 2024 |
807.35 (0.7%) |
815.00 |
775.05 - 817.00 |
0.5431 times |
Thu 26 September 2024 |
801.70 (-0.56%) |
811.00 |
797.00 - 830.00 |
0.7212 times |
Wed 25 September 2024 |
806.20 (2.47%) |
797.90 |
792.20 - 826.05 |
2.3952 times |
Tue 24 September 2024 |
786.75 (0.63%) |
785.00 |
762.30 - 795.00 |
2.5212 times |
Mon 23 September 2024 |
781.85 (4.32%) |
749.50 |
749.50 - 783.30 |
1.0613 times |
Fri 20 September 2024 |
749.50 (1.79%) |
738.00 |
731.00 - 750.00 |
0.7803 times |
Weekly price and charts SolaraActive Strong weekly Stock price targets for SolaraActive SOLARA_BE are 698.23 and 743.38 | Weekly Target 1 | 690.7 | | Weekly Target 2 | 705.75 | | Weekly Target 3 | 735.85 | | Weekly Target 4 | 750.9 | | Weekly Target 5 | 781 |
Weekly price and volumes for Solara Active
| Date |
Closing |
Open |
Range |
Volume |
Mon 07 October 2024 |
720.80 (-5%) |
760.00 |
720.80 - 765.95 |
0.1613 times |
Fri 04 October 2024 |
758.70 (-6.03%) |
810.00 |
737.05 - 827.00 |
0.4016 times |
Fri 27 September 2024 |
807.35 (7.72%) |
749.50 |
749.50 - 830.00 |
1.4781 times |
Fri 20 September 2024 |
749.50 (-3.68%) |
788.95 |
707.00 - 790.00 |
0.5639 times |
Fri 13 September 2024 |
778.10 (4.18%) |
744.00 |
734.85 - 814.00 |
1.6243 times |
Fri 06 September 2024 |
746.85 (5.78%) |
711.00 |
670.75 - 769.95 |
1.0074 times |
Fri 30 August 2024 |
706.05 (-3.22%) |
744.00 |
670.00 - 757.20 |
1.1236 times |
Fri 23 August 2024 |
729.55 (21.2%) |
606.00 |
596.00 - 749.00 |
1.7752 times |
Fri 16 August 2024 |
601.95 (-4.97%) |
637.95 |
585.90 - 640.00 |
0.5519 times |
Fri 09 August 2024 |
633.45 (-8.18%) |
684.00 |
609.00 - 684.00 |
1.3126 times |
Fri 02 August 2024 |
689.85 (11.82%) |
616.95 |
602.55 - 689.85 |
1.5577 times |

Monthly price and charts SolaraActive Strong monthly Stock price targets for SolaraActive SOLARA_BE are 667.7 and 773.9 | Monthly Target 1 | 650 | | Monthly Target 2 | 685.4 | | Monthly Target 3 | 756.2 | | Monthly Target 4 | 791.6 | | Monthly Target 5 | 862.4 |
Monthly price and volumes Solara Active
| Date |
Closing |
Open |
Range |
Volume |
Mon 07 October 2024 |
720.80 (-8.52%) |
799.90 |
720.80 - 827.00 |
0.132 times |
Mon 30 September 2024 |
787.90 (11.59%) |
711.00 |
670.75 - 830.00 |
1.4747 times |
Fri 30 August 2024 |
706.05 (12.83%) |
640.00 |
585.90 - 757.20 |
1.7679 times |
Wed 31 July 2024 |
625.75 (175.36%) |
215.90 |
158.85 - 631.00 |
1.5054 times |
Fri 29 June 2018 |
227.25 (0%) |
265.00 |
227.25 - 265.00 |
0.1201 times |
Fri 18 October 2024 |
(0%) |
|
- |
0 times |

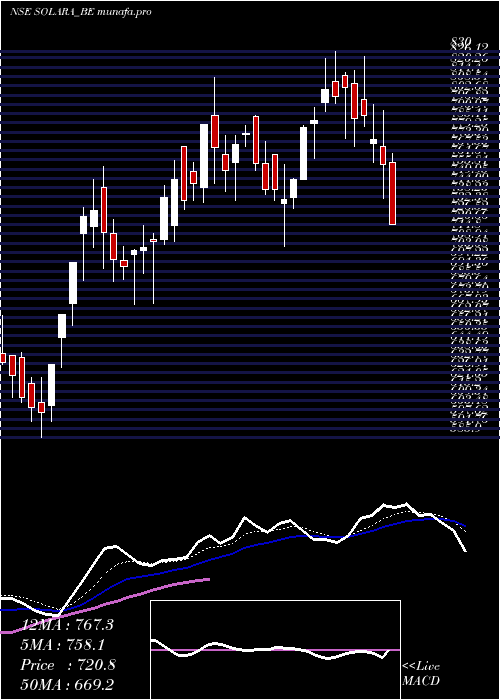
DMA SMA EMA moving averages of Solara Active SOLARA_BE
DMA (daily moving average) of Solara Active SOLARA_BE
| DMA period | DMA value | | 5 day DMA | 766.3 | | 12 day DMA | 775.1 | | 20 day DMA | 770.22 | | 35 day DMA | 744.31 | | 50 day DMA | 710.08 | | 100 day DMA | | | 150 day DMA | | | 200 day DMA | | EMA (exponential moving average) of Solara Active SOLARA_BE
| EMA period | EMA current | EMA prev | EMA prev2 | | 5 day EMA | 758.09 | 776.73 | 785.75 | | 12 day EMA | 767.32 | 775.78 | 778.89 | | 20 day EMA | 760.67 | 764.86 | 765.51 | | 35 day EMA | 735.07 | 735.91 | 734.57 | | 50 day EMA | 705.65 | 705.03 | 702.84 |
SMA (simple moving average) of Solara Active SOLARA_BE
| SMA period | SMA current | SMA prev | SMA prev2 | | 5 day SMA | 766.3 | 783.61 | 792.21 | | 12 day SMA | 775.1 | 776.94 | 775.63 | | 20 day SMA | 770.22 | 771.52 | 770.38 | | 35 day SMA | 744.31 | 740.91 | 736.52 | | 50 day SMA | 710.08 | 707.79 | 705.02 | | 100 day SMA | | 150 day SMA | | 200 day SMA |
|
|
