250 SGBNOV258_GB full analysis,charts,indicators,moving averages,SMA,DMA,EMA,ADX,MACD,RSI2 50 SGBNOV258_GB WideScreen charts, DMA,SMA,EMA technical analysis, forecast prediction, by indicators ADX,MACD,RSI,CCI NSE stock exchange
Daily price and charts and targets 250 Strong Daily Stock price targets for 250 SGBNOV258_GB are 12900 and 12900 | Daily Target 1 | 12900 | | Daily Target 2 | 12900 | | Daily Target 3 | 12900 | | Daily Target 4 | 12900 | | Daily Target 5 | 12900 |
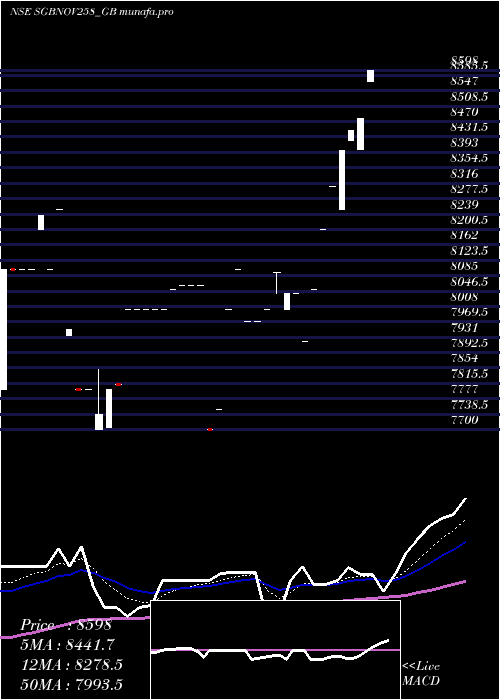
Daily price and volume 2 50
| Date |
Closing |
Open |
Range |
Volume |
Mon 17 November 2025 |
12900.00 (0%) |
12900.00 |
12900.00 - 12900.00 |
0.3704 times |
Fri 14 November 2025 |
12900.00 (-0.77%) |
12800.00 |
12800.00 - 12900.00 |
1.8519 times |
Thu 13 November 2025 |
13000.00 (2.85%) |
13000.00 |
13000.00 - 13000.00 |
1.9753 times |
Wed 12 November 2025 |
12640.00 (3.44%) |
12620.00 |
12620.00 - 12699.00 |
0.7407 times |
Mon 10 November 2025 |
12220.05 (1.74%) |
12280.00 |
12220.01 - 12280.00 |
0.7407 times |
Fri 07 November 2025 |
12011.01 (0.91%) |
12011.01 |
12011.01 - 12011.01 |
0.2469 times |
Tue 04 November 2025 |
11902.42 (-1.63%) |
12300.01 |
11902.42 - 12489.99 |
2.3457 times |
Thu 30 October 2025 |
12100.00 (0%) |
12100.00 |
12100.00 - 12100.00 |
0.1235 times |
Wed 29 October 2025 |
12099.99 (4.31%) |
12099.00 |
12099.00 - 12099.99 |
0.9877 times |
Tue 28 October 2025 |
11600.00 (-6%) |
11505.00 |
11505.00 - 11800.00 |
0.6173 times |
Mon 27 October 2025 |
12340.00 (1.15%) |
12250.21 |
12250.20 - 12500.00 |
1.7284 times |
Weekly price and charts 250 Strong weekly Stock price targets for 250 SGBNOV258_GB are 12900 and 12900 | Weekly Target 1 | 12900 | | Weekly Target 2 | 12900 | | Weekly Target 3 | 12900 | | Weekly Target 4 | 12900 | | Weekly Target 5 | 12900 |
Weekly price and volumes for 2 50
| Date |
Closing |
Open |
Range |
Volume |
Mon 17 November 2025 |
12900.00 (0%) |
12900.00 |
12900.00 - 12900.00 |
0.0867 times |
Fri 14 November 2025 |
12900.00 (7.4%) |
12280.00 |
12220.01 - 13000.00 |
1.2428 times |
Fri 07 November 2025 |
12011.01 (-0.74%) |
12300.01 |
11902.42 - 12489.99 |
0.6069 times |
Thu 30 October 2025 |
12100.00 (-0.82%) |
12250.21 |
11505.00 - 12500.00 |
0.8092 times |
Thu 23 October 2025 |
12200.00 (-7.58%) |
13134.00 |
12101.01 - 13300.00 |
0.9538 times |
Fri 17 October 2025 |
13200.00 (2.33%) |
13125.00 |
13000.00 - 13445.99 |
1.9075 times |
Thu 09 October 2025 |
12900.00 (7.5%) |
12000.00 |
12000.00 - 12900.00 |
1.9942 times |
Fri 03 October 2025 |
12000.00 (0%) |
12000.00 |
12000.00 - 12000.00 |
1.3295 times |
Fri 26 September 2025 |
12000.00 (2.99%) |
11662.73 |
11662.73 - 12000.00 |
0.4913 times |
Fri 19 September 2025 |
11651.07 (-0.54%) |
11773.45 |
11300.00 - 11773.45 |
0.578 times |
Fri 12 September 2025 |
11714.88 (1.43%) |
11607.75 |
11607.75 - 11714.88 |
0.4335 times |

Monthly price and charts 250 Strong monthly Stock price targets for 250 SGBNOV258_GB are 12401.21 and 13498.79 | Monthly Target 1 | 11503.23 | | Monthly Target 2 | 12201.61 | | Monthly Target 3 | 12600.806666667 | | Monthly Target 4 | 13299.19 | | Monthly Target 5 | 13698.39 |
Monthly price and volumes 2 50
| Date |
Closing |
Open |
Range |
Volume |
Mon 17 November 2025 |
12900.00 (6.61%) |
12300.01 |
11902.42 - 13000.00 |
0.594 times |
Thu 30 October 2025 |
12100.00 (0.83%) |
12000.00 |
11505.00 - 13445.99 |
2.1454 times |
Fri 26 September 2025 |
12000.00 (11.52%) |
10971.46 |
10971.46 - 12000.00 |
0.8245 times |
Fri 29 August 2025 |
10760.00 (8.63%) |
9925.12 |
9925.12 - 10760.00 |
2.4645 times |
Thu 31 July 2025 |
9905.00 (1.59%) |
9700.00 |
9532.01 - 10000.00 |
0.3103 times |
Mon 30 June 2025 |
9750.00 (2.63%) |
9700.00 |
9350.00 - 10000.00 |
1.5248 times |
Wed 21 May 2025 |
9500.00 (2.15%) |
9500.00 |
9200.50 - 9500.00 |
0.1418 times |
Fri 25 April 2025 |
9300.00 (5.25%) |
8836.00 |
8700.00 - 9490.00 |
1.1613 times |
Fri 28 March 2025 |
8836.25 (2.77%) |
8550.01 |
8363.90 - 8850.00 |
0.3989 times |
Fri 14 February 2025 |
8598.00 (6.81%) |
8200.00 |
8200.00 - 8598.00 |
0.4344 times |
Tue 28 January 2025 |
8050.00 (-0.62%) |
7970.00 |
7920.01 - 8092.00 |
0.5053 times |

DMA SMA EMA moving averages of 2 50 SGBNOV258_GB
DMA (daily moving average) of 2 50 SGBNOV258_GB
| DMA period | DMA value | | 5 day DMA | 12732.01 | | 12 day DMA | 12326.12 | | 20 day DMA | 12612.32 | | 35 day DMA | 12240.93 | | 50 day DMA | 11655.51 | | 100 day DMA | 10466.26 | | 150 day DMA | 9625.68 | | 200 day DMA | 9057.77 | EMA (exponential moving average) of 2 50 SGBNOV258_GB
| EMA period | EMA current | EMA prev | EMA prev2 | | 5 day EMA | 12734.64 | 12651.97 | 12527.98 | | 12 day EMA | 12549.03 | 12485.24 | 12409.86 | | 20 day EMA | 12414.1 | 12362.97 | 12306.47 | | 35 day EMA | 12025.56 | 11974.08 | 11919.57 | | 50 day EMA | 11619.07 | 11566.81 | 11512.42 |
SMA (simple moving average) of 2 50 SGBNOV258_GB
| SMA period | SMA current | SMA prev | SMA prev2 | | 5 day SMA | 12732.01 | 12554.21 | 12354.7 | | 12 day SMA | 12326.12 | 12359.37 | 12378.87 | | 20 day SMA | 12612.32 | 12575.1 | 12530.1 | | 35 day SMA | 12240.93 | 12185.83 | 12124.69 | | 50 day SMA | 11655.51 | 11594.59 | 11531.1 | | 100 day SMA | 10466.26 | 10416.46 | 10367.87 | | 150 day SMA | 9625.68 | 9590.42 | 9554.92 | | 200 day SMA | 9057.77 | 9027.01 | 8995.01 |
|
|
