Sgb250 SGBMAY25_GB full analysis,charts,indicators,moving averages,SMA,DMA,EMA,ADX,MACD,RSISgb2 50 SGBMAY25_GB WideScreen charts, DMA,SMA,EMA technical analysis, forecast prediction, by indicators ADX,MACD,RSI,CCI NSE stock exchange
Daily price and charts and targets Sgb250 Strong Daily Stock price targets for Sgb250 SGBMAY25_GB are 9497.5 and 9592.5 | Daily Target 1 | 9423.33 | | Daily Target 2 | 9476.67 | | Daily Target 3 | 9518.3333333333 | | Daily Target 4 | 9571.67 | | Daily Target 5 | 9613.33 |
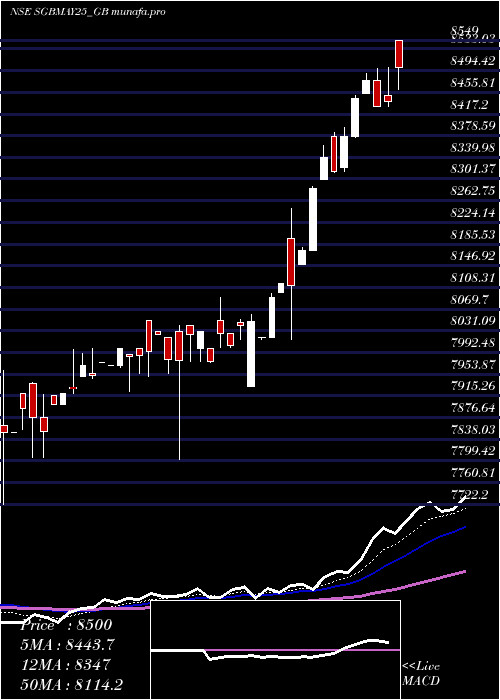
Daily price and volume Sgb2 50
| Date |
Closing |
Open |
Range |
Volume |
Tue 06 May 2025 |
9530.00 (0.82%) |
9465.00 |
9465.00 - 9560.00 |
0.5161 times |
Mon 05 May 2025 |
9452.58 (1%) |
9409.01 |
9409.01 - 9495.00 |
0.8571 times |
Fri 02 May 2025 |
9359.00 (-0.65%) |
9420.12 |
9250.19 - 9420.12 |
3.2995 times |
Wed 30 April 2025 |
9420.12 (-0.06%) |
9530.00 |
9400.00 - 9530.00 |
1.0783 times |
Tue 29 April 2025 |
9425.38 (0.16%) |
9449.97 |
9400.00 - 9450.00 |
1.4931 times |
Mon 28 April 2025 |
9410.75 (0.13%) |
9398.99 |
9305.00 - 9500.00 |
0.8664 times |
Fri 25 April 2025 |
9398.99 (-0.8%) |
9475.00 |
9331.00 - 9500.00 |
0.2212 times |
Thu 24 April 2025 |
9475.00 (-2.32%) |
9425.01 |
9202.01 - 9545.00 |
0.2488 times |
Tue 22 April 2025 |
9700.00 (2.27%) |
9500.00 |
9500.00 - 9725.00 |
0.8664 times |
Mon 21 April 2025 |
9485.00 (1.19%) |
9352.00 |
9352.00 - 9620.00 |
0.553 times |
Thu 17 April 2025 |
9373.80 (0.31%) |
9400.00 |
9255.00 - 9700.00 |
2.0553 times |
Weekly price and charts Sgb250 Strong weekly Stock price targets for Sgb250 SGBMAY25_GB are 9469.51 and 9620.5 | Weekly Target 1 | 9348.68 | | Weekly Target 2 | 9439.34 | | Weekly Target 3 | 9499.67 | | Weekly Target 4 | 9590.33 | | Weekly Target 5 | 9650.66 |
Weekly price and volumes for Sgb2 50
| Date |
Closing |
Open |
Range |
Volume |
Tue 06 May 2025 |
9530.00 (1.83%) |
9409.01 |
9409.01 - 9560.00 |
0.3867 times |
Fri 02 May 2025 |
9359.00 (-0.43%) |
9398.99 |
9250.19 - 9530.00 |
1.8972 times |
Fri 25 April 2025 |
9398.99 (0.27%) |
9352.00 |
9202.01 - 9725.00 |
0.5321 times |
Thu 17 April 2025 |
9373.80 (3.52%) |
9099.99 |
9099.99 - 9700.00 |
1.2873 times |
Fri 11 April 2025 |
9055.04 (2.55%) |
8830.00 |
8502.00 - 9195.00 |
1.0615 times |
Fri 04 April 2025 |
8830.01 (0.63%) |
8801.00 |
8780.03 - 9099.99 |
1.116 times |
Fri 28 March 2025 |
8775.00 (0.38%) |
8741.73 |
8600.16 - 8888.00 |
0.6255 times |
Fri 21 March 2025 |
8741.73 (2.84%) |
8525.00 |
8525.00 - 8800.00 |
1.4872 times |
Thu 13 March 2025 |
8500.00 (0.47%) |
8599.97 |
8405.00 - 8599.97 |
0.8098 times |
Fri 07 March 2025 |
8460.00 (0.61%) |
8489.99 |
8341.00 - 8599.95 |
0.7968 times |
Fri 28 February 2025 |
8408.91 (-1.77%) |
8574.00 |
8351.00 - 8589.99 |
0.6488 times |

Monthly price and charts Sgb250 Strong monthly Stock price targets for Sgb250 SGBMAY25_GB are 9390.1 and 9699.91 | Monthly Target 1 | 9136.92 | | Monthly Target 2 | 9333.46 | | Monthly Target 3 | 9446.73 | | Monthly Target 4 | 9643.27 | | Monthly Target 5 | 9756.54 |
Monthly price and volumes Sgb2 50
| Date |
Closing |
Open |
Range |
Volume |
Tue 06 May 2025 |
9530.00 (1.17%) |
9420.12 |
9250.19 - 9560.00 |
0.3264 times |
Wed 30 April 2025 |
9420.12 (7.35%) |
8801.00 |
8502.00 - 9725.00 |
1.2316 times |
Fri 28 March 2025 |
8775.00 (4.35%) |
8489.99 |
8341.00 - 8888.00 |
0.9226 times |
Fri 28 February 2025 |
8408.91 (3.66%) |
8150.00 |
8150.00 - 8589.99 |
1.4743 times |
Fri 31 January 2025 |
8111.62 (2.42%) |
7929.80 |
7801.10 - 8248.95 |
0.7062 times |
Tue 31 December 2024 |
7919.99 (-0.93%) |
7945.00 |
7722.20 - 8099.99 |
0.9238 times |
Fri 29 November 2024 |
7994.00 (-2.8%) |
8221.00 |
7685.71 - 8284.00 |
0.6683 times |
Thu 31 October 2024 |
8224.59 (3.37%) |
7976.56 |
7725.11 - 8552.00 |
1.8348 times |
Mon 30 September 2024 |
7956.56 (6.1%) |
7400.00 |
7360.01 - 7999.00 |
0.8659 times |
Fri 30 August 2024 |
7498.99 (2.35%) |
7400.00 |
7151.00 - 7499.00 |
1.0462 times |
Wed 31 July 2024 |
7327.08 (-0.72%) |
7379.90 |
7161.37 - 7799.99 |
1.0584 times |

DMA SMA EMA moving averages of Sgb2 50 SGBMAY25_GB
DMA (daily moving average) of Sgb2 50 SGBMAY25_GB
| DMA period | DMA value | | 5 day DMA | 9437.42 | | 12 day DMA | 9447.97 | | 20 day DMA | 9216.48 | | 35 day DMA | 8971.16 | | 50 day DMA | 8828.22 | | 100 day DMA | 8433.12 | | 150 day DMA | 8277.92 | | 200 day DMA | 8072.12 | EMA (exponential moving average) of Sgb2 50 SGBMAY25_GB
| EMA period | EMA current | EMA prev | EMA prev2 | | 5 day EMA | 9455.38 | 9418.07 | 9400.82 | | 12 day EMA | 9369.02 | 9339.76 | 9319.25 | | 20 day EMA | 9246.94 | 9217.16 | 9192.39 | | 35 day EMA | 9055.82 | 9027.9 | 9002.9 | | 50 day EMA | 8854.79 | 8827.24 | 8801.73 |
SMA (simple moving average) of Sgb2 50 SGBMAY25_GB
| SMA period | SMA current | SMA prev | SMA prev2 | | 5 day SMA | 9437.42 | 9413.57 | 9402.85 | | 12 day SMA | 9447.97 | 9420.05 | 9386.92 | | 20 day SMA | 9216.48 | 9187.5 | 9153.63 | | 35 day SMA | 8971.16 | 8941.61 | 8913.54 | | 50 day SMA | 8828.22 | 8806.22 | 8786.7 | | 100 day SMA | 8433.12 | 8417.28 | 8402.59 | | 150 day SMA | 8277.92 | 8264.32 | 8251.11 | | 200 day SMA | 8072.12 | 8061.92 | 8051.71 |
|
|
