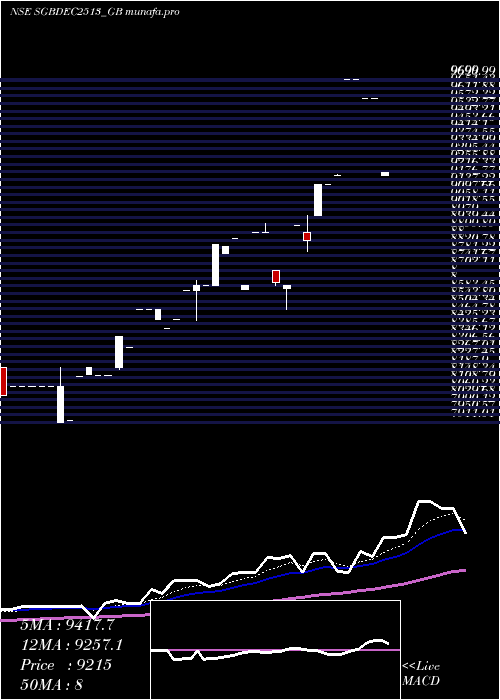
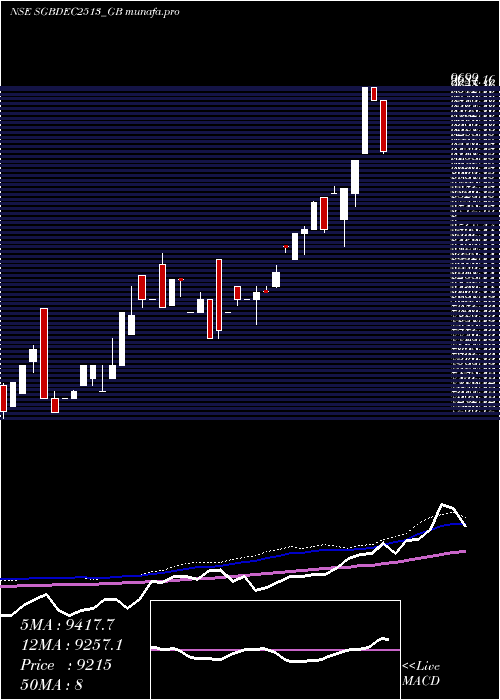
250 SGBDEC2513_GB full analysis,charts,indicators,moving averages,SMA,DMA,EMA,ADX,MACD,RSI2 50 SGBDEC2513_GB WideScreen charts, DMA,SMA,EMA technical analysis, forecast prediction, by indicators ADX,MACD,RSI,CCI NSE stock exchange
Daily price and charts and targets 250 Strong Daily Stock price targets for 250 SGBDEC2513_GB are 13245 and 13245 | Daily Target 1 | 13245 | | Daily Target 2 | 13245 | | Daily Target 3 | 13245 | | Daily Target 4 | 13245 | | Daily Target 5 | 13245 |
Daily price and volume 2 50
| Date |
Closing |
Open |
Range |
Volume |
Tue 04 November 2025 |
13245.00 (0.04%) |
13245.00 |
13245.00 - 13245.00 |
0.3704 times |
Fri 31 October 2025 |
13240.00 (0%) |
13240.00 |
13240.00 - 13240.00 |
0.5556 times |
Thu 30 October 2025 |
13240.00 (0.05%) |
13240.00 |
13240.00 - 13240.00 |
0.1852 times |
Wed 29 October 2025 |
13233.50 (5.34%) |
12625.32 |
12625.32 - 13300.00 |
2.5926 times |
Tue 28 October 2025 |
12562.51 (0.5%) |
12562.51 |
12562.51 - 12562.51 |
0.1852 times |
Mon 27 October 2025 |
12500.01 (-0.79%) |
13000.00 |
12500.01 - 13000.00 |
0.5556 times |
Fri 24 October 2025 |
12599.69 (-0.5%) |
12265.01 |
12215.11 - 12599.69 |
1.1111 times |
Thu 23 October 2025 |
12663.00 (-9.55%) |
12740.00 |
12600.00 - 12740.00 |
3.7037 times |
Tue 21 October 2025 |
14000.00 (0.57%) |
14000.00 |
14000.00 - 14000.00 |
0.5556 times |
Mon 20 October 2025 |
13920.00 (-0.57%) |
13920.00 |
13920.00 - 13920.00 |
0.1852 times |
Fri 17 October 2025 |
14000.00 (4.48%) |
14000.00 |
13999.99 - 14000.00 |
3.7037 times |
Weekly price and charts 250 Strong weekly Stock price targets for 250 SGBDEC2513_GB are 13245 and 13245 | Weekly Target 1 | 13245 | | Weekly Target 2 | 13245 | | Weekly Target 3 | 13245 | | Weekly Target 4 | 13245 | | Weekly Target 5 | 13245 |
Weekly price and volumes for 2 50
| Date |
Closing |
Open |
Range |
Volume |
Tue 04 November 2025 |
13245.00 (0.04%) |
13245.00 |
13245.00 - 13245.00 |
0.0766 times |
Fri 31 October 2025 |
13240.00 (5.08%) |
13000.00 |
12500.01 - 13300.00 |
0.8429 times |
Fri 24 October 2025 |
12599.69 (-10%) |
13920.00 |
12215.11 - 14000.00 |
1.1494 times |
Fri 17 October 2025 |
14000.00 (7.69%) |
13500.00 |
13400.00 - 14000.00 |
1.8008 times |
Thu 09 October 2025 |
13000.00 (1.96%) |
12686.25 |
12686.25 - 13000.00 |
0.3065 times |
Fri 03 October 2025 |
12750.00 (10.87%) |
12139.36 |
12000.00 - 12750.00 |
0.3065 times |
Wed 24 September 2025 |
11500.00 (-1.71%) |
11700.00 |
11151.01 - 12100.00 |
1.6092 times |
Thu 18 September 2025 |
11700.00 (-4.88%) |
12300.00 |
11499.90 - 12300.00 |
0.3065 times |
Thu 11 September 2025 |
12300.00 (6.14%) |
11899.99 |
11899.99 - 12300.00 |
2.3755 times |
Fri 05 September 2025 |
11588.00 (7.6%) |
10854.00 |
10854.00 - 11600.00 |
1.2261 times |
Fri 29 August 2025 |
10770.00 (4.56%) |
10300.00 |
10300.00 - 10770.00 |
1.5326 times |
Monthly price and charts 250 Strong monthly Stock price targets for 250 SGBDEC2513_GB are 13245 and 13245 | Monthly Target 1 | 13245 | | Monthly Target 2 | 13245 | | Monthly Target 3 | 13245 | | Monthly Target 4 | 13245 | | Monthly Target 5 | 13245 |
Monthly price and volumes 2 50
| Date |
Closing |
Open |
Range |
Volume |
Tue 04 November 2025 |
13245.00 (0.04%) |
13245.00 |
13245.00 - 13245.00 |
0.0206 times |
Fri 31 October 2025 |
13240.00 (8.08%) |
12000.00 |
12000.00 - 14000.00 |
1.1317 times |
Tue 30 September 2025 |
12250.00 (13.74%) |
10854.00 |
10854.00 - 12400.00 |
1.5329 times |
Fri 29 August 2025 |
10770.00 (8.02%) |
9999.00 |
9980.00 - 10770.00 |
1.8004 times |
Tue 29 July 2025 |
9970.00 (-0.3%) |
9825.00 |
9825.00 - 9990.00 |
0.4012 times |
Wed 25 June 2025 |
10000.00 (5.29%) |
9500.00 |
9500.00 - 10000.00 |
0.7407 times |
Fri 30 May 2025 |
9497.25 (-1.07%) |
9600.00 |
9200.00 - 9750.00 |
0.5041 times |
Wed 30 April 2025 |
9600.00 (11.3%) |
8900.00 |
8500.00 - 9699.00 |
1.8313 times |
Fri 28 March 2025 |
8625.00 (0%) |
8625.00 |
8605.00 - 8871.13 |
1.43 times |
Thu 27 February 2025 |
8625.00 (5.76%) |
8200.00 |
8188.01 - 8649.00 |
0.607 times |
Fri 31 January 2025 |
8155.00 (3.74%) |
8000.00 |
7911.01 - 8200.00 |
0.5864 times |
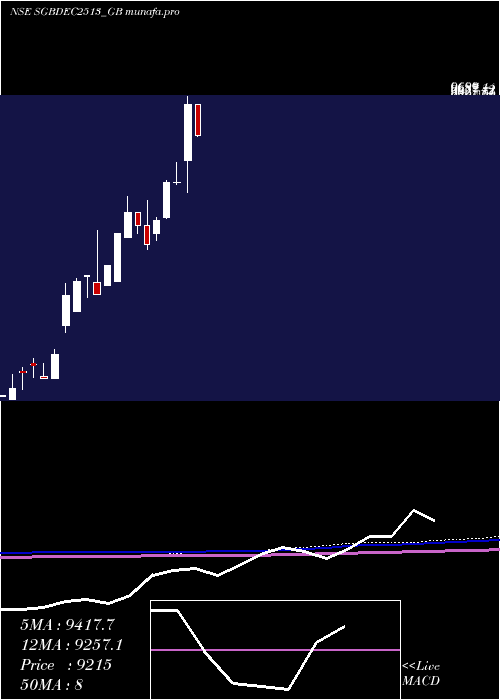
DMA SMA EMA moving averages of 2 50 SGBDEC2513_GB
DMA (daily moving average) of 2 50 SGBDEC2513_GB
| DMA period | DMA value | | 5 day DMA | 13104.2 | | 12 day DMA | 13216.98 | | 20 day DMA | 13021.06 | | 35 day DMA | 12445.11 | | 50 day DMA | 11749.38 | | 100 day DMA | 10354.9 | | 150 day DMA | 9546.85 | | 200 day DMA | 9005.86 | EMA (exponential moving average) of 2 50 SGBDEC2513_GB
| EMA period | EMA current | EMA prev | EMA prev2 | | 5 day EMA | 13154.6 | 13109.41 | 13044.12 | | 12 day EMA | 13072.95 | 13041.68 | 13005.64 | | 20 day EMA | 12875.04 | 12836.11 | 12793.61 | | 35 day EMA | 12343.17 | 12290.08 | 12234.16 | | 50 day EMA | 11736.14 | 11674.58 | 11610.71 |
SMA (simple moving average) of 2 50 SGBDEC2513_GB
| SMA period | SMA current | SMA prev | SMA prev2 | | 5 day SMA | 13104.2 | 12955.2 | 12827.14 | | 12 day SMA | 13216.98 | 13243.89 | 13304.68 | | 20 day SMA | 13021.06 | 12948.81 | 12871.81 | | 35 day SMA | 12445.11 | 12366.89 | 12282.89 | | 50 day SMA | 11749.38 | 11684.48 | 11619.68 | | 100 day SMA | 10354.9 | 10303.45 | 10252.05 | | 150 day SMA | 9546.85 | 9507.92 | 9468.99 | | 200 day SMA | 9005.86 | 8976.13 | 8945.95 |
|
|
