StateBank SBIN_T0 full analysis,charts,indicators,moving averages,SMA,DMA,EMA,ADX,MACD,RSIState Bank SBIN_T0 WideScreen charts, DMA,SMA,EMA technical analysis, forecast prediction, by indicators ADX,MACD,RSI,CCI NSE stock exchange
Daily price and charts and targets StateBank Strong Daily Stock price targets for StateBank SBIN_T0 are 938.5 and 938.5 | Daily Target 1 | 938 | | Daily Target 2 | 938 | | Daily Target 3 | 939 | | Daily Target 4 | 939 | | Daily Target 5 | 939 |
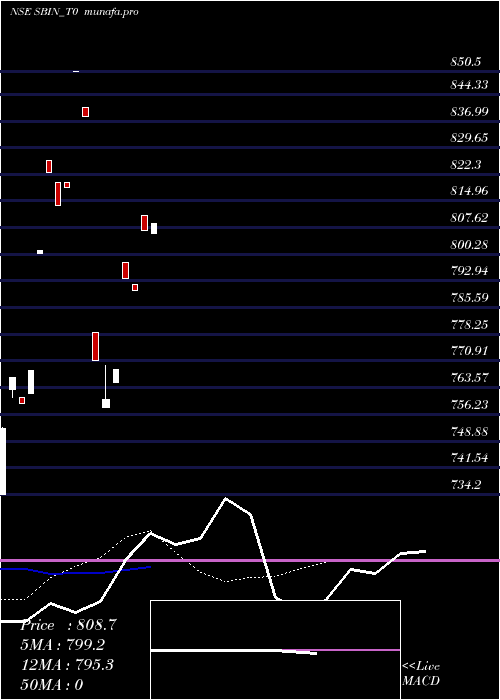
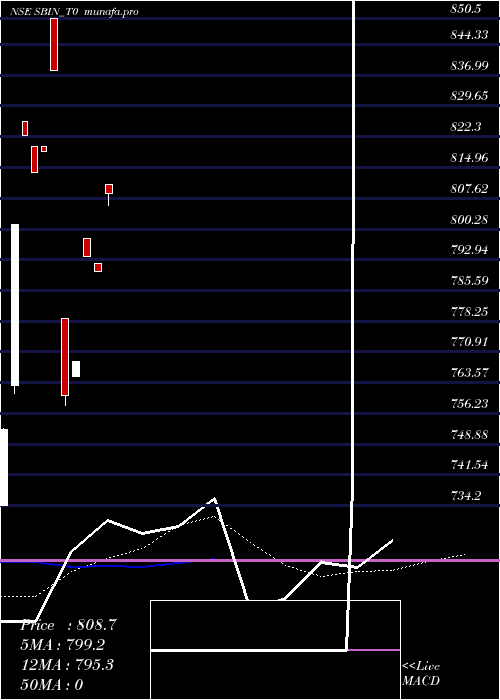
Daily price and volume State Bank
| Date |
Closing |
Open |
Range |
Volume |
Fri 31 October 2025 |
937.00 (0.28%) |
940.00 |
940.00 - 940.00 |
0.3571 times |
Thu 30 October 2025 |
934.35 (1.26%) |
931.00 |
931.00 - 931.00 |
0.3571 times |
Mon 27 October 2025 |
922.75 (1.68%) |
910.00 |
910.00 - 920.00 |
0.7143 times |
Mon 20 October 2025 |
907.50 (2.32%) |
907.00 |
907.00 - 907.00 |
0.3571 times |
Thu 16 October 2025 |
886.95 (0.1%) |
889.00 |
889.00 - 890.10 |
0.7143 times |
Wed 15 October 2025 |
886.10 (0.36%) |
885.00 |
885.00 - 890.00 |
1.0714 times |
Mon 13 October 2025 |
882.95 (0.26%) |
880.65 |
880.65 - 893.00 |
2.8571 times |
Fri 10 October 2025 |
880.65 (1.54%) |
871.00 |
870.85 - 871.00 |
1.0714 times |
Fri 03 October 2025 |
867.30 (0.13%) |
865.00 |
865.00 - 865.00 |
0.7143 times |
Wed 24 September 2025 |
866.20 (8.01%) |
874.95 |
862.90 - 874.95 |
1.7857 times |
Thu 28 August 2025 |
801.95 (-1.75%) |
810.00 |
810.00 - 810.00 |
1.0714 times |
Weekly price and charts StateBank Strong weekly Stock price targets for StateBank SBIN_T0 are 923.5 and 953.5 | Weekly Target 1 | 899 | | Weekly Target 2 | 918 | | Weekly Target 3 | 929 | | Weekly Target 4 | 948 | | Weekly Target 5 | 959 |
Weekly price and volumes for State Bank
| Date |
Closing |
Open |
Range |
Volume |
Fri 31 October 2025 |
937.00 (3.25%) |
910.00 |
910.00 - 940.00 |
0.7407 times |
Mon 20 October 2025 |
907.50 (2.32%) |
907.00 |
907.00 - 907.00 |
0.1852 times |
Thu 16 October 2025 |
886.95 (0.72%) |
880.65 |
880.65 - 893.00 |
2.4074 times |
Fri 10 October 2025 |
880.65 (1.54%) |
871.00 |
870.85 - 871.00 |
0.5556 times |
Fri 03 October 2025 |
867.30 (8.15%) |
874.95 |
862.90 - 874.95 |
1.2963 times |
Thu 28 August 2025 |
801.95 (-1.75%) |
810.00 |
810.00 - 810.00 |
0.5556 times |
Fri 22 August 2025 |
816.25 (-1.25%) |
830.00 |
827.65 - 830.00 |
0.7407 times |
Thu 14 August 2025 |
826.55 (0.39%) |
826.00 |
826.00 - 830.00 |
0.3704 times |
Fri 18 July 2025 |
823.35 (1.82%) |
825.00 |
825.00 - 825.00 |
0.1852 times |
Fri 11 July 2025 |
808.65 (2.33%) |
811.00 |
806.00 - 811.00 |
2.963 times |
Mon 23 June 2025 |
790.20 (-0.44%) |
792.00 |
792.00 - 792.00 |
2.7778 times |

Monthly price and charts StateBank Strong monthly Stock price targets for StateBank SBIN_T0 are 901 and 976 | Monthly Target 1 | 839 | | Monthly Target 2 | 888 | | Monthly Target 3 | 914 | | Monthly Target 4 | 963 | | Monthly Target 5 | 989 |
Monthly price and volumes State Bank
| Date |
Closing |
Open |
Range |
Volume |
Fri 31 October 2025 |
937.00 (8.17%) |
865.00 |
865.00 - 940.00 |
0.888 times |
Wed 24 September 2025 |
866.20 (8.01%) |
874.95 |
862.90 - 874.95 |
0.1931 times |
Thu 28 August 2025 |
801.95 (-2.7%) |
830.00 |
810.00 - 830.00 |
0.3089 times |
Mon 21 July 2025 |
824.20 (4.3%) |
811.00 |
806.00 - 826.00 |
0.695 times |
Mon 23 June 2025 |
790.20 (-0.44%) |
792.00 |
792.00 - 792.00 |
0.5792 times |
Tue 27 May 2025 |
793.70 (3.27%) |
798.00 |
798.00 - 798.00 |
0.5792 times |
Tue 08 April 2025 |
768.60 (1.07%) |
765.00 |
765.00 - 765.00 |
0.0772 times |
Thu 09 January 2025 |
760.45 (-9.27%) |
778.85 |
758.10 - 778.85 |
5.7915 times |
Wed 18 December 2024 |
838.15 (2.37%) |
850.50 |
840.75 - 850.50 |
0.8494 times |
Thu 05 September 2024 |
818.75 (0.62%) |
820.00 |
820.00 - 820.00 |
0.0386 times |
Mon 19 August 2024 |
813.70 (-1.09%) |
820.00 |
820.00 - 820.00 |
0.0386 times |
DMA SMA EMA moving averages of State Bank SBIN_T0
DMA (daily moving average) of State Bank SBIN_T0
| DMA period | DMA value | | 5 day DMA | 917.71 | | 12 day DMA | 882.5 | | 20 day DMA | 854.56 | | 35 day DMA | | | 50 day DMA | | | 100 day DMA | | | 150 day DMA | | | 200 day DMA | | EMA (exponential moving average) of State Bank SBIN_T0
| EMA period | EMA current | EMA prev | EMA prev2 | | 5 day EMA | 919.51 | 910.77 | 898.98 | | 12 day EMA | 890.04 | 881.5 | 871.9 | | 20 day EMA | 866.76 | 859.37 | 851.48 | | 35 day EMA | 0 | 0 | 0 | | 50 day EMA | 0 | 0 | 0 |
SMA (simple moving average) of State Bank SBIN_T0
| SMA period | SMA current | SMA prev | SMA prev2 | | 5 day SMA | 917.71 | 907.53 | 897.25 | | 12 day SMA | 882.5 | 873.38 | 864.4 | | 20 day SMA | 854.56 | 846.14 | 837.44 | | 35 day SMA | | 50 day SMA | | 100 day SMA | | 150 day SMA | | 200 day SMA |
|
|
