SbiLife SBILIFE_BL full analysis,charts,indicators,moving averages,SMA,DMA,EMA,ADX,MACD,RSISbi Life SBILIFE_BL WideScreen charts, DMA,SMA,EMA technical analysis, forecast prediction, by indicators ADX,MACD,RSI,CCI NSE stock exchange
Daily price and charts and targets SbiLife Strong Daily Stock price targets for SbiLife SBILIFE_BL are 2020 and 2020 | Daily Target 1 | 2020 | | Daily Target 2 | 2020 | | Daily Target 3 | 2020 | | Daily Target 4 | 2020 | | Daily Target 5 | 2020 |
Daily price and volume Sbi Life
| Date |
Closing |
Open |
Range |
Volume |
Wed 10 December 2025 |
2020.00 (10.07%) |
2020.00 |
2020.00 - 2020.00 |
0.4808 times |
Mon 14 July 2025 |
1835.20 (42.29%) |
1835.20 |
1835.20 - 1835.20 |
0.1487 times |
Mon 31 July 2023 |
1289.75 (3.16%) |
1289.75 |
1289.75 - 1289.75 |
0.4882 times |
Mon 14 November 2022 |
1250.25 (-1.76%) |
1250.25 |
1250.25 - 1250.25 |
0.6972 times |
Thu 03 November 2022 |
1272.65 (1.2%) |
1272.65 |
1272.65 - 1272.65 |
0.6972 times |
Tue 25 October 2022 |
1257.60 (0.57%) |
1257.60 |
1257.60 - 1257.60 |
0.3751 times |
Mon 03 October 2022 |
1250.45 (-1.28%) |
1250.45 |
1250.45 - 1250.45 |
0.5767 times |
Mon 08 August 2022 |
1266.65 (8.73%) |
1266.65 |
1266.65 - 1266.65 |
0.5797 times |
Mon 25 July 2022 |
1164.95 (9.04%) |
1164.95 |
1164.95 - 1164.95 |
0.5797 times |
Tue 29 March 2022 |
1068.35 (-11.64%) |
1068.35 |
1068.35 - 1068.35 |
5.3768 times |
Mon 04 October 2021 |
1209.05 (0%) |
1209.05 |
1209.05 - 1209.05 |
0.4081 times |
Weekly price and charts SbiLife Strong weekly Stock price targets for SbiLife SBILIFE_BL are 1927.6 and 2112.4 | Weekly Target 1 | 1773.6 | | Weekly Target 2 | 1896.8 | | Weekly Target 3 | 1958.4 | | Weekly Target 4 | 2081.6 | | Weekly Target 5 | 2143.2 |
Weekly price and volumes for Sbi Life
| Date |
Closing |
Open |
Range |
Volume |
Wed 10 December 2025 |
2020.00 (56.62%) |
1835.20 |
1835.20 - 2020.00 |
0.4234 times |
Mon 31 July 2023 |
1289.75 (3.16%) |
1289.75 |
1289.75 - 1289.75 |
0.3284 times |
Mon 14 November 2022 |
1250.25 (-1.76%) |
1250.25 |
1250.25 - 1250.25 |
0.4689 times |
Thu 03 November 2022 |
1272.65 (0.47%) |
1250.45 |
1250.45 - 1272.65 |
1.1091 times |
Mon 08 August 2022 |
1266.65 (8.73%) |
1266.65 |
1266.65 - 1266.65 |
0.3899 times |
Mon 25 July 2022 |
1164.95 (9.04%) |
1164.95 |
1164.95 - 1164.95 |
0.3899 times |
Tue 29 March 2022 |
1068.35 (0%) |
1209.05 |
1068.35 - 1209.05 |
3.8906 times |
Fri 12 December 2025 |
(0%) |
|
- |
0 times |

Monthly price and charts SbiLife Strong monthly Stock price targets for SbiLife SBILIFE_BL are 2020 and 2020 | Monthly Target 1 | 2020 | | Monthly Target 2 | 2020 | | Monthly Target 3 | 2020 | | Monthly Target 4 | 2020 | | Monthly Target 5 | 2020 |
Monthly price and volumes Sbi Life
| Date |
Closing |
Open |
Range |
Volume |
Wed 10 December 2025 |
2020.00 (10.07%) |
2020.00 |
2020.00 - 2020.00 |
0.3695 times |
Mon 14 July 2025 |
1835.20 (46.79%) |
1289.75 |
1289.75 - 1835.20 |
0.4896 times |
Mon 14 November 2022 |
1250.25 (-0.58%) |
1272.65 |
1250.25 - 1272.65 |
1.0718 times |
Tue 25 October 2022 |
1257.60 (-0.71%) |
1250.45 |
1250.45 - 1257.60 |
0.7316 times |
Mon 08 August 2022 |
1266.65 (8.73%) |
1266.65 |
1266.65 - 1266.65 |
0.4455 times |
Mon 25 July 2022 |
1164.95 (9.04%) |
1164.95 |
1164.95 - 1164.95 |
0.4455 times |
Tue 29 March 2022 |
1068.35 (-11.64%) |
1068.35 |
1068.35 - 1068.35 |
4.1328 times |
Mon 04 October 2021 |
1209.05 (0%) |
1209.05 |
1209.05 - 1209.05 |
0.3136 times |
Fri 12 December 2025 |
(0%) |
|
- |
0 times |

DMA SMA EMA moving averages of Sbi Life SBILIFE_BL
DMA (daily moving average) of Sbi Life SBILIFE_BL
| DMA period | DMA value | | 5 day DMA | 1533.57 | | 12 day DMA | | | 20 day DMA | | | 35 day DMA | | | 50 day DMA | | | 100 day DMA | | | 150 day DMA | | | 200 day DMA | | EMA (exponential moving average) of Sbi Life SBILIFE_BL
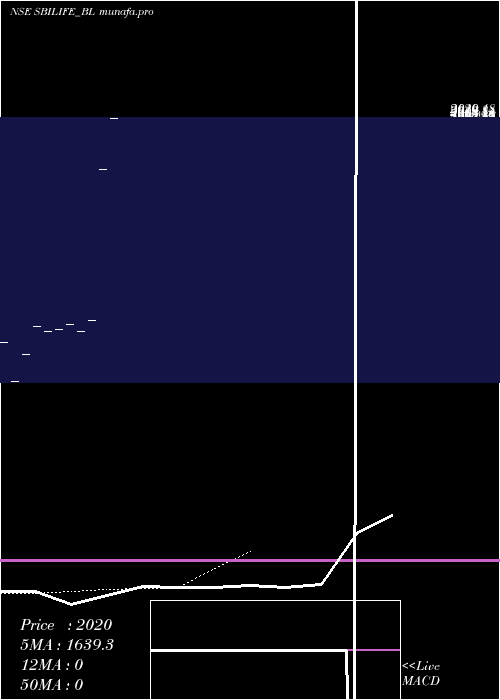
| EMA period | EMA current | EMA prev | EMA prev2 | | 5 day EMA | 1639.31 | 1449 | 1255.93 | | 12 day EMA | 0 | 0 | 0 | | 20 day EMA | 0 | 0 | 0 | | 35 day EMA | 0 | 0 | 0 | | 50 day EMA | 0 | 0 | 0 |
SMA (simple moving average) of Sbi Life SBILIFE_BL
| SMA period | SMA current | SMA prev | SMA prev2 | | 5 day SMA | 1533.57 | 1381.09 | 1264.14 | | 12 day SMA | | 20 day SMA | | 35 day SMA | | 50 day SMA | | 100 day SMA | | 150 day SMA | | 200 day SMA |
|
|
