ParamountComm PARACABLES_BE full analysis,charts,indicators,moving averages,SMA,DMA,EMA,ADX,MACD,RSIParamount Comm PARACABLES_BE WideScreen charts, DMA,SMA,EMA technical analysis, forecast prediction, by indicators ADX,MACD,RSI,CCI NSE stock exchange
Daily price and charts and targets ParamountComm Strong Daily Stock price targets for ParamountComm PARACABLES_BE are 71.35 and 72.75 | Daily Target 1 | 71.1 | | Daily Target 2 | 71.6 | | Daily Target 3 | 72.5 | | Daily Target 4 | 73 | | Daily Target 5 | 73.9 |
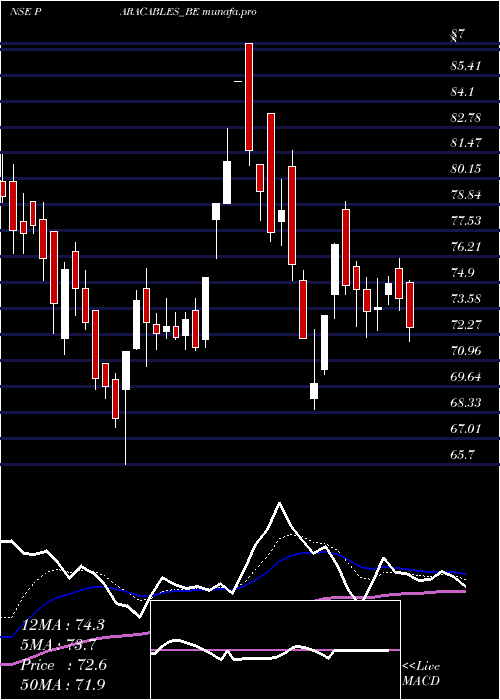
Daily price and volume Paramount Comm
| Date |
Closing |
Open |
Range |
Volume |
Fri 17 May 2024 |
72.10 (-0.76%) |
72.70 |
72.00 - 73.40 |
0.6358 times |
Thu 16 May 2024 |
72.65 (0.48%) |
72.40 |
72.05 - 74.10 |
0.76 times |
Wed 15 May 2024 |
72.30 (-0.75%) |
72.80 |
71.50 - 73.35 |
0.7348 times |
Tue 14 May 2024 |
72.85 (-1.55%) |
74.60 |
70.65 - 75.60 |
1.1056 times |
Mon 13 May 2024 |
74.00 (3.64%) |
71.55 |
71.50 - 74.50 |
1.2577 times |
Fri 10 May 2024 |
71.40 (5%) |
69.50 |
65.70 - 71.40 |
1.5353 times |
Thu 09 May 2024 |
68.00 (-2.37%) |
70.00 |
67.55 - 70.30 |
0.661 times |
Wed 08 May 2024 |
69.65 (-0.57%) |
70.80 |
69.00 - 70.80 |
1.4265 times |
Tue 07 May 2024 |
70.05 (-3.84%) |
73.50 |
69.50 - 73.50 |
1.1595 times |
Mon 06 May 2024 |
72.85 (-2.35%) |
74.60 |
72.55 - 75.50 |
0.7238 times |
Fri 03 May 2024 |
74.60 (-1.26%) |
76.50 |
73.25 - 76.95 |
0.9119 times |
Weekly price and charts ParamountComm Strong weekly Stock price targets for ParamountComm PARACABLES_BE are 71.38 and 76.33 | Weekly Target 1 | 67.83 | | Weekly Target 2 | 69.97 | | Weekly Target 3 | 72.783333333333 | | Weekly Target 4 | 74.92 | | Weekly Target 5 | 77.73 |
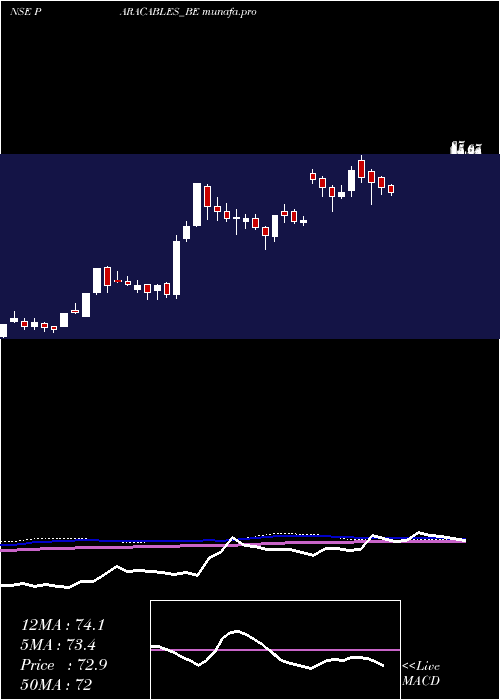
Weekly price and volumes for Paramount Comm
| Date |
Closing |
Open |
Range |
Volume |
Fri 17 May 2024 |
72.10 (0.98%) |
71.55 |
70.65 - 75.60 |
0.837 times |
Fri 10 May 2024 |
71.40 (-4.29%) |
74.60 |
65.70 - 75.50 |
1.0255 times |
Fri 03 May 2024 |
74.60 (-4.11%) |
78.10 |
71.25 - 78.95 |
1.2185 times |
Fri 26 April 2024 |
77.80 (24.88%) |
80.00 |
76.35 - 81.40 |
0.7007 times |
Fri 24 November 2023 |
62.30 (0.32%) |
61.60 |
60.50 - 64.00 |
0.5458 times |
Fri 17 November 2023 |
62.10 (-3.04%) |
65.90 |
61.20 - 66.50 |
0.9741 times |
Fri 10 November 2023 |
64.05 (-0.08%) |
65.70 |
61.75 - 68.50 |
1.2186 times |
Fri 03 November 2023 |
64.10 (13.25%) |
56.15 |
54.50 - 64.10 |
0.8337 times |
Fri 27 October 2023 |
56.60 (-4.95%) |
59.55 |
51.50 - 60.00 |
1.2274 times |
Fri 20 October 2023 |
59.55 (-5.33%) |
63.10 |
59.05 - 64.60 |
1.4187 times |
Fri 13 October 2023 |
62.90 (-0.63%) |
62.00 |
59.20 - 64.60 |
0.9198 times |
Monthly price and charts ParamountComm Strong monthly Stock price targets for ParamountComm PARACABLES_BE are 68.9 and 80.15 | Monthly Target 1 | 60.33 | | Monthly Target 2 | 66.22 | | Monthly Target 3 | 71.583333333333 | | Monthly Target 4 | 77.47 | | Monthly Target 5 | 82.83 |
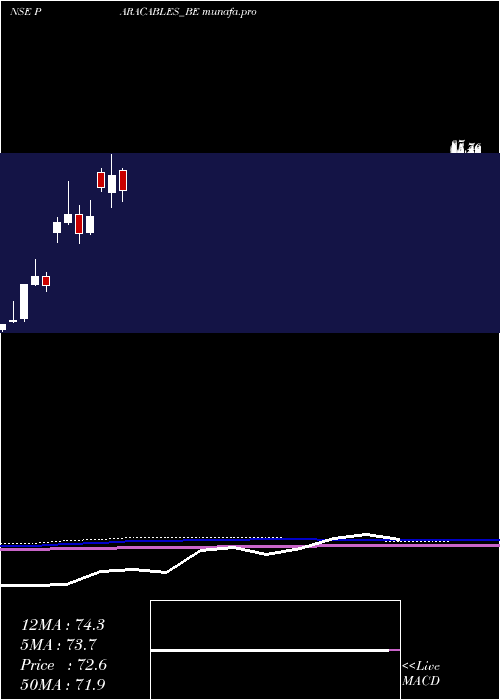
Monthly price and volumes Paramount Comm
| Date |
Closing |
Open |
Range |
Volume |
Fri 17 May 2024 |
72.10 (-2.37%) |
72.05 |
65.70 - 76.95 |
0.3781 times |
Tue 30 April 2024 |
73.85 (18.54%) |
80.00 |
72.30 - 81.40 |
0.2167 times |
Fri 24 November 2023 |
62.30 (12.45%) |
55.85 |
55.00 - 68.50 |
0.509 times |
Tue 31 October 2023 |
55.40 (-11.99%) |
62.95 |
51.50 - 66.50 |
0.7722 times |
Fri 29 September 2023 |
62.95 (5.53%) |
59.95 |
59.00 - 76.25 |
1.2871 times |
Thu 31 August 2023 |
59.65 (72.9%) |
56.00 |
51.65 - 61.90 |
0.4492 times |
Mon 27 February 2023 |
34.50 (-9.33%) |
38.00 |
32.30 - 39.80 |
0.6168 times |
Tue 31 January 2023 |
38.05 (9.03%) |
34.95 |
34.45 - 44.85 |
1.7958 times |
Fri 30 December 2022 |
34.90 (69.42%) |
21.25 |
20.10 - 34.90 |
2.426 times |
Wed 30 November 2022 |
20.60 (8.14%) |
20.00 |
19.60 - 28.00 |
1.5492 times |
Mon 31 October 2022 |
19.05 (6.13%) |
17.50 |
16.00 - 19.05 |
0.2681 times |
DMA SMA EMA moving averages of Paramount Comm PARACABLES_BE
DMA (daily moving average) of Paramount Comm PARACABLES_BE
| DMA period | DMA value | | 5 day DMA | 72.78 | | 12 day DMA | 72.17 | | 20 day DMA | 72.6 | | 35 day DMA | 68.73 | | 50 day DMA | 65.86 | | 100 day DMA | 60.18 | | 150 day DMA | 50.84 | | 200 day DMA | 42.98 | EMA (exponential moving average) of Paramount Comm PARACABLES_BE
| EMA period | EMA current | EMA prev | EMA prev2 | | 5 day EMA | 72.28 | 72.37 | 72.23 | | 12 day EMA | 72.02 | 72.01 | 71.89 | | 20 day EMA | 71.15 | 71.05 | 70.88 | | 35 day EMA | 69.04 | 68.86 | 68.64 | | 50 day EMA | 66.27 | 66.03 | 65.76 |
SMA (simple moving average) of Paramount Comm PARACABLES_BE
| SMA period | SMA current | SMA prev | SMA prev2 | | 5 day SMA | 72.78 | 72.64 | 71.71 | | 12 day SMA | 72.17 | 72.31 | 72.6 | | 20 day SMA | 72.6 | 72.11 | 71.6 | | 35 day SMA | 68.73 | 68.33 | 67.84 | | 50 day SMA | 65.86 | 65.64 | 65.41 | | 100 day SMA | 60.18 | 59.84 | 59.49 | | 150 day SMA | 50.84 | 50.52 | 50.19 | | 200 day SMA | 42.98 | 42.67 | 42.36 |
|
|
