OnePoint ONEPOINT_BE full analysis,charts,indicators,moving averages,SMA,DMA,EMA,ADX,MACD,RSIOne Point ONEPOINT_BE WideScreen charts, DMA,SMA,EMA technical analysis, forecast prediction, by indicators ADX,MACD,RSI,CCI NSE stock exchange
Daily price and charts and targets OnePoint Strong Daily Stock price targets for OnePoint ONEPOINT_BE are 42.48 and 44.36 | Daily Target 1 | 41.06 | | Daily Target 2 | 42.01 | | Daily Target 3 | 42.943333333333 | | Daily Target 4 | 43.89 | | Daily Target 5 | 44.82 |
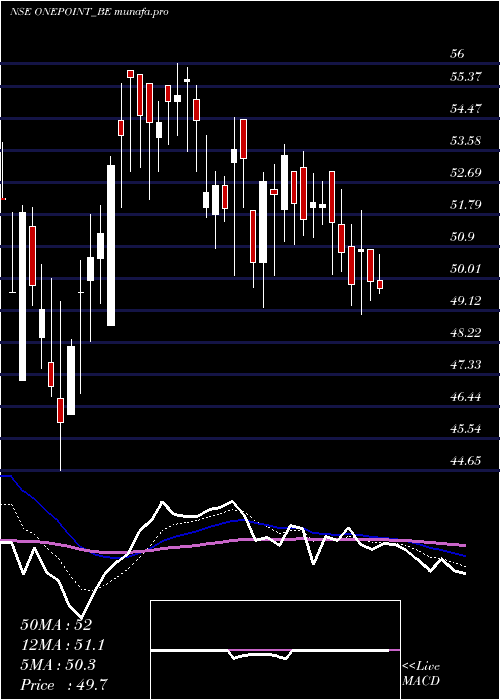
Daily price and volume One Point
| Date |
Closing |
Open |
Range |
Volume |
Fri 29 August 2025 |
42.95 (-0.74%) |
42.00 |
42.00 - 43.88 |
0.289 times |
Thu 28 August 2025 |
43.27 (-3.59%) |
44.88 |
42.63 - 45.48 |
0.531 times |
Tue 26 August 2025 |
44.88 (-0.36%) |
45.26 |
44.51 - 46.00 |
0.356 times |
Mon 25 August 2025 |
45.04 (-1.03%) |
45.05 |
44.50 - 45.99 |
0.2748 times |
Fri 22 August 2025 |
45.51 (0.93%) |
45.65 |
45.00 - 46.00 |
0.2533 times |
Thu 21 August 2025 |
45.09 (-1.74%) |
46.48 |
44.95 - 46.49 |
6.0075 times |
Wed 20 August 2025 |
45.89 (-2.57%) |
47.10 |
45.52 - 47.10 |
0.3766 times |
Tue 19 August 2025 |
47.10 (1.75%) |
45.99 |
45.70 - 47.50 |
0.6172 times |
Mon 18 August 2025 |
46.29 (-0.6%) |
46.82 |
44.50 - 47.90 |
1.1403 times |
Thu 14 August 2025 |
46.57 (1.2%) |
46.79 |
45.55 - 46.79 |
0.1543 times |
Wed 13 August 2025 |
46.02 (-0.5%) |
46.48 |
45.90 - 46.80 |
0.1944 times |
Weekly price and charts OnePoint Strong weekly Stock price targets for OnePoint ONEPOINT_BE are 40.48 and 44.48 | Weekly Target 1 | 39.65 | | Weekly Target 2 | 41.3 | | Weekly Target 3 | 43.65 | | Weekly Target 4 | 45.3 | | Weekly Target 5 | 47.65 |
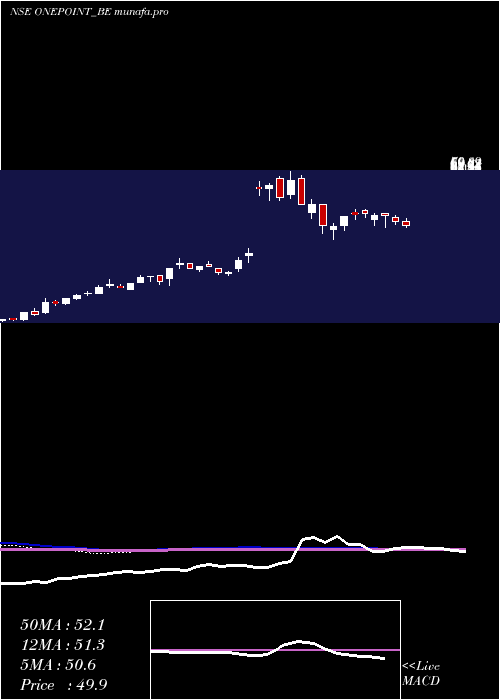
Weekly price and volumes for One Point
| Date |
Closing |
Open |
Range |
Volume |
Fri 29 August 2025 |
42.95 (-5.63%) |
45.05 |
42.00 - 46.00 |
0.4337 times |
Fri 22 August 2025 |
45.51 (-2.28%) |
46.82 |
44.50 - 47.90 |
2.5099 times |
Thu 14 August 2025 |
46.57 (-0.11%) |
46.76 |
45.55 - 47.48 |
0.2667 times |
Fri 08 August 2025 |
46.62 (-4.92%) |
49.45 |
45.50 - 49.89 |
0.686 times |
Fri 01 August 2025 |
49.03 (-0.18%) |
48.51 |
47.25 - 50.80 |
0.5847 times |
Fri 25 July 2025 |
49.12 (-2.15%) |
51.50 |
48.51 - 51.80 |
0.6327 times |
Fri 18 July 2025 |
50.20 (1.43%) |
49.83 |
48.50 - 53.47 |
2.3914 times |
Fri 11 July 2025 |
49.49 (-0.48%) |
49.73 |
49.00 - 50.60 |
0.4649 times |
Fri 04 July 2025 |
49.73 (-3.57%) |
51.50 |
49.00 - 52.49 |
1.069 times |
Fri 27 June 2025 |
51.57 (-3.5%) |
53.00 |
50.11 - 53.55 |
0.961 times |
Fri 20 June 2025 |
53.44 (-0.3%) |
54.45 |
49.19 - 54.45 |
2.6796 times |
Monthly price and charts OnePoint Strong monthly Stock price targets for OnePoint ONEPOINT_BE are 38.23 and 46.73 | Monthly Target 1 | 36.65 | | Monthly Target 2 | 39.8 | | Monthly Target 3 | 45.15 | | Monthly Target 4 | 48.3 | | Monthly Target 5 | 53.65 |
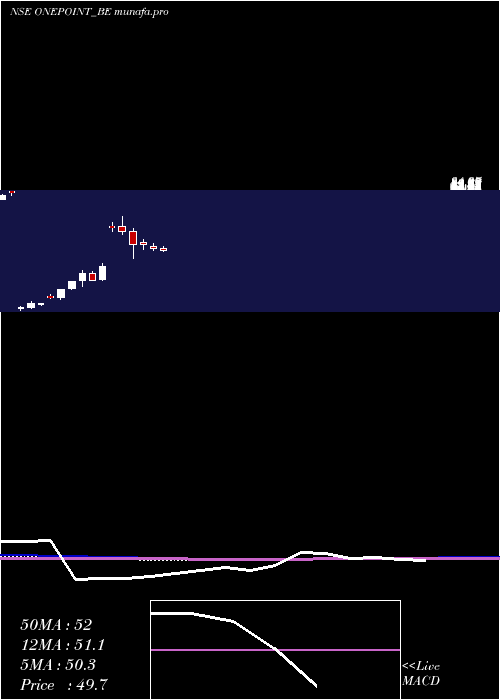
Monthly price and volumes One Point
| Date |
Closing |
Open |
Range |
Volume |
Fri 29 August 2025 |
42.95 (-12.97%) |
49.89 |
42.00 - 50.50 |
1.0547 times |
Thu 31 July 2025 |
49.35 (-2.72%) |
50.90 |
47.75 - 53.47 |
1.2652 times |
Mon 30 June 2025 |
50.73 (-4.91%) |
51.90 |
49.19 - 53.75 |
0.9789 times |
Mon 22 April 2024 |
53.35 (0.38%) |
54.40 |
50.10 - 56.00 |
0.6099 times |
Thu 28 March 2024 |
53.15 (-13.08%) |
61.05 |
44.65 - 62.85 |
2.4525 times |
Thu 29 February 2024 |
61.15 (-2.94%) |
64.00 |
59.00 - 70.00 |
1.3666 times |
Wed 31 January 2024 |
63.00 (59.09%) |
63.90 |
61.00 - 66.10 |
0.0502 times |
Fri 17 November 2023 |
39.60 (24.72%) |
32.35 |
31.70 - 41.45 |
0.8375 times |
Tue 31 October 2023 |
31.75 (-11.81%) |
36.00 |
31.40 - 36.75 |
0.5229 times |
Fri 29 September 2023 |
36.00 (17.26%) |
31.30 |
27.85 - 37.80 |
0.8617 times |
Thu 31 August 2023 |
30.70 (18.3%) |
26.50 |
26.05 - 30.70 |
1.5306 times |
DMA SMA EMA moving averages of One Point ONEPOINT_BE
DMA (daily moving average) of One Point ONEPOINT_BE
| DMA period | DMA value | | 5 day DMA | 44.33 | | 12 day DMA | 45.41 | | 20 day DMA | 46.37 | | 35 day DMA | 47.85 | | 50 day DMA | 48.8 | | 100 day DMA | 52.47 | | 150 day DMA | 47.82 | | 200 day DMA | 42.56 | EMA (exponential moving average) of One Point ONEPOINT_BE
| EMA period | EMA current | EMA prev | EMA prev2 | | 5 day EMA | 44.08 | 44.64 | 45.33 | | 12 day EMA | 45.22 | 45.63 | 46.06 | | 20 day EMA | 46.12 | 46.45 | 46.79 | | 35 day EMA | 47.41 | 47.67 | 47.93 | | 50 day EMA | 48.65 | 48.88 | 49.11 |
SMA (simple moving average) of One Point ONEPOINT_BE
| SMA period | SMA current | SMA prev | SMA prev2 | | 5 day SMA | 44.33 | 44.76 | 45.28 | | 12 day SMA | 45.41 | 45.69 | 45.97 | | 20 day SMA | 46.37 | 46.69 | 46.99 | | 35 day SMA | 47.85 | 48.04 | 48.23 | | 50 day SMA | 48.8 | 49 | 49.14 | | 100 day SMA | 52.47 | 52.66 | 52.86 | | 150 day SMA | 47.82 | 47.72 | 47.63 | | 200 day SMA | 42.56 | 42.45 | 42.35 |
|
|
