866 NTPC_N3 full analysis,charts,indicators,moving averages,SMA,DMA,EMA,ADX,MACD,RSI8 66 NTPC_N3 WideScreen charts, DMA,SMA,EMA technical analysis, forecast prediction, by indicators ADX,MACD,RSI,CCI NSE stock exchange
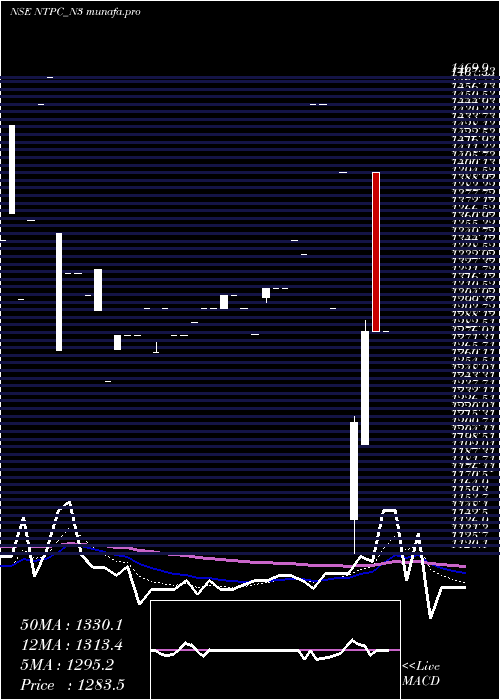
Daily price and charts and targets 866 Strong Daily Stock price targets for 866 NTPC_N3 are 1283.51 and 1283.51 | Daily Target 1 | 1283.51 | | Daily Target 2 | 1283.51 | | Daily Target 3 | 1283.51 | | Daily Target 4 | 1283.51 | | Daily Target 5 | 1283.51 |
Daily price and volume 8 66
| Date |
Closing |
Open |
Range |
Volume |
Fri 03 May 2024 |
1283.51 (0%) |
1283.51 |
1283.51 - 1283.51 |
0.0234 times |
Thu 02 May 2024 |
1283.51 (0%) |
1400.00 |
1283.51 - 1400.00 |
0.6341 times |
Tue 30 April 2024 |
1283.51 (5.5%) |
1200.00 |
1200.00 - 1291.00 |
7.6108 times |
Tue 23 April 2024 |
1216.59 (-13.1%) |
1145.00 |
1120.10 - 1221.00 |
0.5638 times |
Tue 13 February 2024 |
1400.00 (7.69%) |
1400.00 |
1400.00 - 1400.00 |
0.4735 times |
Fri 02 February 2024 |
1300.00 (-10.34%) |
1300.00 |
1300.00 - 1300.00 |
0.1589 times |
Tue 02 January 2024 |
1450.00 (0%) |
1450.00 |
1450.00 - 1450.00 |
0.3597 times |
Wed 27 December 2023 |
1450.00 (8.21%) |
1450.00 |
1450.00 - 1450.00 |
0.0084 times |
Wed 08 November 2023 |
1340.00 (-0.74%) |
1340.00 |
1340.00 - 1340.00 |
0.0837 times |
Thu 19 October 2023 |
1350.00 (2.66%) |
1350.00 |
1350.00 - 1350.00 |
0.0837 times |
Fri 13 October 2023 |
1315.00 (0%) |
1315.00 |
1315.00 - 1315.00 |
0.01 times |
Weekly price and charts 866 Strong weekly Stock price targets for 866 NTPC_N3 are 1241.76 and 1441.76 | Weekly Target 1 | 1094.5 | | Weekly Target 2 | 1189.01 | | Weekly Target 3 | 1294.5033333333 | | Weekly Target 4 | 1389.01 | | Weekly Target 5 | 1494.5 |
Weekly price and volumes for 8 66
| Date |
Closing |
Open |
Range |
Volume |
Fri 03 May 2024 |
1283.51 (5.5%) |
1200.00 |
1200.00 - 1400.00 |
3.1981 times |
Tue 23 April 2024 |
1216.59 (-13.1%) |
1145.00 |
1120.10 - 1221.00 |
0.2181 times |
Tue 13 February 2024 |
1400.00 (7.69%) |
1400.00 |
1400.00 - 1400.00 |
0.1831 times |
Fri 02 February 2024 |
1300.00 (-10.34%) |
1450.00 |
1300.00 - 1450.00 |
0.2006 times |
Wed 27 December 2023 |
1450.00 (8.21%) |
1450.00 |
1450.00 - 1450.00 |
0.0032 times |
Wed 08 November 2023 |
1340.00 (-0.74%) |
1340.00 |
1340.00 - 1340.00 |
0.0324 times |
Thu 19 October 2023 |
1350.00 (2.66%) |
1350.00 |
1350.00 - 1350.00 |
0.0324 times |
Fri 13 October 2023 |
1315.00 (0%) |
1315.00 |
1315.00 - 1315.00 |
0.0039 times |
Fri 06 October 2023 |
1315.00 (2.65%) |
1308.10 |
1305.00 - 1315.00 |
5.1304 times |
Wed 31 May 2023 |
1281.00 (-2.21%) |
1300.00 |
1281.00 - 1300.00 |
0.9979 times |
Tue 09 May 2023 |
1310.00 (0.77%) |
1300.00 |
1300.00 - 1310.00 |
0.1676 times |
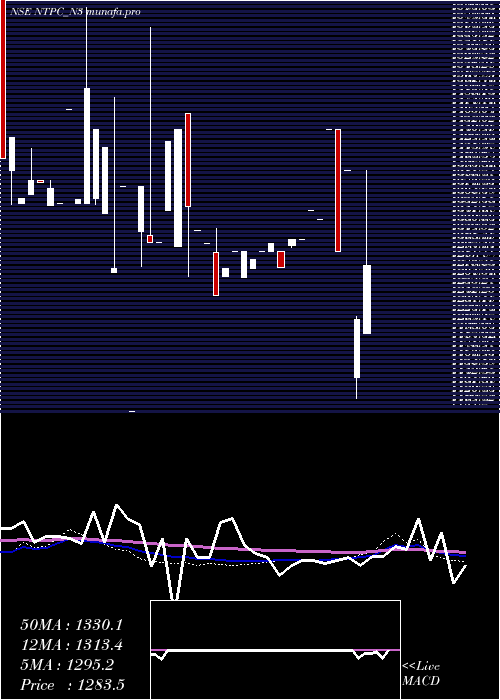
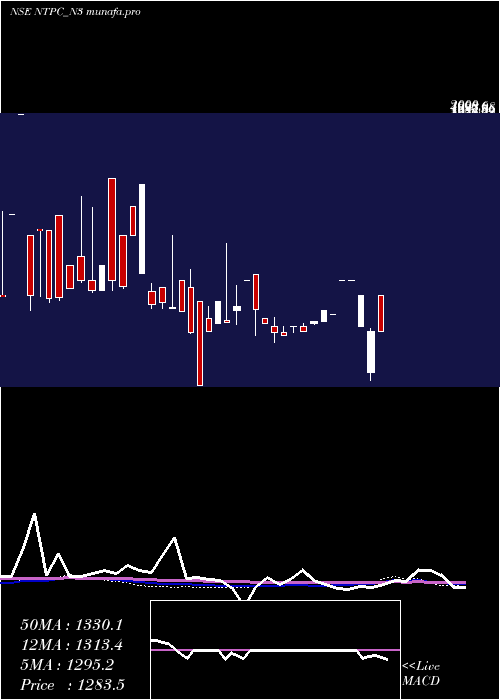
Monthly price and charts 866 Strong monthly Stock price targets for 866 NTPC_N3 are 1225.27 and 1341.76 | Monthly Target 1 | 1205.85 | | Monthly Target 2 | 1244.68 | | Monthly Target 3 | 1322.34 | | Monthly Target 4 | 1361.17 | | Monthly Target 5 | 1438.83 |
Monthly price and volumes 8 66
| Date |
Closing |
Open |
Range |
Volume |
Fri 03 May 2024 |
1283.51 (0%) |
1400.00 |
1283.51 - 1400.00 |
0.2403 times |
Tue 30 April 2024 |
1283.51 (-8.32%) |
1145.00 |
1120.10 - 1291.00 |
2.9871 times |
Tue 13 February 2024 |
1400.00 (-3.45%) |
1300.00 |
1300.00 - 1400.00 |
0.2311 times |
Tue 02 January 2024 |
1450.00 (0%) |
1450.00 |
1450.00 - 1450.00 |
0.1314 times |
Wed 27 December 2023 |
1450.00 (8.21%) |
1450.00 |
1450.00 - 1450.00 |
0.0031 times |
Wed 08 November 2023 |
1340.00 (-0.74%) |
1340.00 |
1340.00 - 1340.00 |
0.0306 times |
Thu 19 October 2023 |
1350.00 (2.66%) |
1315.00 |
1315.00 - 1350.00 |
0.0422 times |
Mon 07 August 2023 |
1315.00 (2.65%) |
1308.10 |
1305.00 - 1315.00 |
4.8389 times |
Wed 31 May 2023 |
1281.00 (-1.46%) |
1300.00 |
1281.00 - 1310.00 |
1.1011 times |
Thu 27 April 2023 |
1300.00 (2.52%) |
1300.00 |
1280.00 - 1300.00 |
0.3943 times |
Mon 27 March 2023 |
1268.10 (-0.93%) |
1280.00 |
1268.00 - 1300.00 |
0.1473 times |
DMA SMA EMA moving averages of 8 66 NTPC_N3
DMA (daily moving average) of 8 66 NTPC_N3
| DMA period | DMA value | | 5 day DMA | 1293.42 | | 12 day DMA | 1332.26 | | 20 day DMA | 1319.66 | | 35 day DMA | 1314.96 | | 50 day DMA | 1320.3 | | 100 day DMA | 1373.09 | | 150 day DMA | 1396.63 | | 200 day DMA | | EMA (exponential moving average) of 8 66 NTPC_N3
| EMA period | EMA current | EMA prev | EMA prev2 | | 5 day EMA | 1295.17 | 1301 | 1309.74 | | 12 day EMA | 1313.39 | 1318.82 | 1325.24 | | 20 day EMA | 1316.49 | 1319.96 | 1323.8 | | 35 day EMA | 1320.15 | 1322.31 | 1324.59 | | 50 day EMA | 1317.33 | 1318.71 | 1320.15 |
SMA (simple moving average) of 8 66 NTPC_N3
| SMA period | SMA current | SMA prev | SMA prev2 | | 5 day SMA | 1293.42 | 1296.72 | 1330.02 | | 12 day SMA | 1332.26 | 1334.88 | 1334.68 | | 20 day SMA | 1319.66 | 1319.48 | 1319.31 | | 35 day SMA | 1314.96 | 1319.72 | 1322.03 | | 50 day SMA | 1320.3 | 1322.23 | 1322.14 | | 100 day SMA | 1373.09 | 1374.76 | 1376.42 | | 150 day SMA | 1396.63 | 1398 | | 200 day SMA |
|
|
