NdlVentures NDLVENTURE_BE full analysis,charts,indicators,moving averages,SMA,DMA,EMA,ADX,MACD,RSINdl Ventures NDLVENTURE_BE WideScreen charts, DMA,SMA,EMA technical analysis, forecast prediction, by indicators ADX,MACD,RSI,CCI NSE stock exchange
Daily price and charts and targets NdlVentures Strong Daily Stock price targets for NdlVentures NDLVENTURE_BE are 85.36 and 89.86 | Daily Target 1 | 84.57 | | Daily Target 2 | 86.14 | | Daily Target 3 | 89.07 | | Daily Target 4 | 90.64 | | Daily Target 5 | 93.57 |
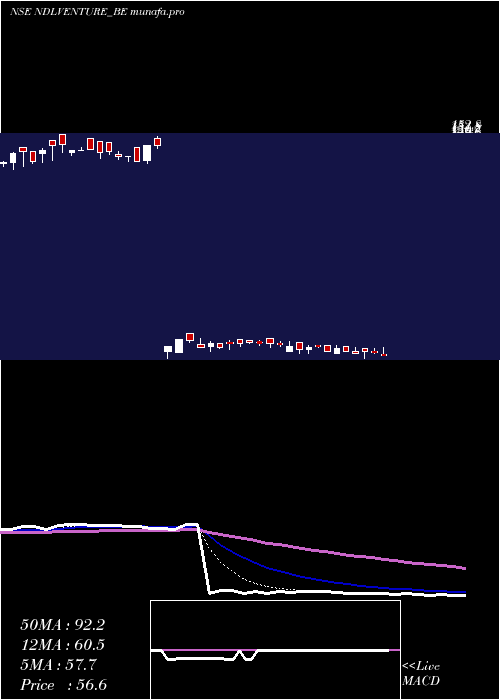
Daily price and volume Ndl Ventures
| Date |
Closing |
Open |
Range |
Volume |
Mon 03 November 2025 |
87.71 (0.01%) |
88.13 |
87.50 - 92.00 |
3.7377 times |
Fri 31 October 2025 |
87.70 (3.48%) |
84.00 |
84.00 - 88.50 |
0.8262 times |
Thu 30 October 2025 |
84.75 (-1.35%) |
85.75 |
83.00 - 86.72 |
0.7139 times |
Wed 29 October 2025 |
85.91 (1.49%) |
84.76 |
84.75 - 86.39 |
0.6495 times |
Tue 28 October 2025 |
84.65 (-0.9%) |
85.00 |
83.51 - 86.00 |
0.8602 times |
Mon 27 October 2025 |
85.42 (0.58%) |
87.00 |
84.62 - 87.00 |
1.3328 times |
Fri 24 October 2025 |
84.93 (0.22%) |
84.80 |
83.00 - 85.50 |
1.0431 times |
Thu 23 October 2025 |
84.74 (1.15%) |
80.33 |
80.33 - 86.00 |
0.1767 times |
Tue 21 October 2025 |
83.78 (2.08%) |
82.10 |
82.10 - 85.50 |
0.1576 times |
Mon 20 October 2025 |
82.07 (-0.59%) |
86.00 |
81.11 - 86.00 |
0.5023 times |
Fri 17 October 2025 |
82.56 (-0.7%) |
83.00 |
82.00 - 83.00 |
0.2083 times |
Weekly price and charts NdlVentures Strong weekly Stock price targets for NdlVentures NDLVENTURE_BE are 85.36 and 89.86 | Weekly Target 1 | 84.57 | | Weekly Target 2 | 86.14 | | Weekly Target 3 | 89.07 | | Weekly Target 4 | 90.64 | | Weekly Target 5 | 93.57 |
Weekly price and volumes for Ndl Ventures
| Date |
Closing |
Open |
Range |
Volume |
Mon 03 November 2025 |
87.71 (0.01%) |
88.13 |
87.50 - 92.00 |
0.9709 times |
Fri 31 October 2025 |
87.70 (3.26%) |
87.00 |
83.00 - 88.50 |
1.1385 times |
Fri 24 October 2025 |
84.93 (2.87%) |
86.00 |
80.33 - 86.00 |
0.4883 times |
Fri 17 October 2025 |
82.56 (-2.01%) |
85.95 |
80.00 - 85.95 |
1.5206 times |
Fri 10 October 2025 |
84.25 (-1.24%) |
86.00 |
82.00 - 89.00 |
0.7124 times |
Fri 03 October 2025 |
85.31 (2.75%) |
80.50 |
80.07 - 86.15 |
1.0262 times |
Fri 26 September 2025 |
83.03 (-3.28%) |
86.70 |
80.77 - 86.94 |
1.2804 times |
Fri 19 September 2025 |
85.85 (-1.41%) |
85.35 |
83.57 - 88.35 |
0.5395 times |
Fri 12 September 2025 |
87.08 (-1.46%) |
86.88 |
85.00 - 90.00 |
1.2421 times |
Fri 05 September 2025 |
88.37 (-2.13%) |
93.40 |
85.00 - 93.40 |
1.0811 times |
Fri 29 August 2025 |
90.29 (1.14%) |
90.99 |
85.81 - 93.72 |
1.419 times |

Monthly price and charts NdlVentures Strong monthly Stock price targets for NdlVentures NDLVENTURE_BE are 85.36 and 89.86 | Monthly Target 1 | 84.57 | | Monthly Target 2 | 86.14 | | Monthly Target 3 | 89.07 | | Monthly Target 4 | 90.64 | | Monthly Target 5 | 93.57 |
Monthly price and volumes Ndl Ventures
| Date |
Closing |
Open |
Range |
Volume |
Mon 03 November 2025 |
87.71 (0.01%) |
88.13 |
87.50 - 92.00 |
0.3501 times |
Fri 31 October 2025 |
87.70 (5.11%) |
80.07 |
80.00 - 89.00 |
1.6151 times |
Tue 30 September 2025 |
83.44 (-7.59%) |
93.40 |
80.50 - 93.40 |
1.6409 times |
Fri 29 August 2025 |
90.29 (40.11%) |
87.40 |
82.95 - 93.78 |
1.5976 times |
Fri 04 July 2025 |
64.44 (0.62%) |
64.04 |
62.50 - 66.88 |
0.1239 times |
Mon 30 June 2025 |
64.04 (-0.53%) |
65.90 |
62.01 - 70.01 |
0.6885 times |
Fri 30 May 2025 |
64.38 (10.98%) |
57.30 |
55.00 - 67.00 |
0.9882 times |
Wed 30 April 2025 |
58.01 (-60.76%) |
58.00 |
55.15 - 66.00 |
1.4591 times |
Fri 24 November 2023 |
147.85 (7.96%) |
132.00 |
132.00 - 152.80 |
0.9427 times |
Tue 31 October 2023 |
136.95 (-4.4%) |
145.20 |
131.20 - 150.75 |
0.594 times |
Fri 29 September 2023 |
143.25 (5.99%) |
135.00 |
124.15 - 150.00 |
0.9339 times |

DMA SMA EMA moving averages of Ndl Ventures NDLVENTURE_BE
DMA (daily moving average) of Ndl Ventures NDLVENTURE_BE
| DMA period | DMA value | | 5 day DMA | 86.14 | | 12 day DMA | 84.78 | | 20 day DMA | 84.42 | | 35 day DMA | 84.52 | | 50 day DMA | 85.76 | | 100 day DMA | 74.87 | | 150 day DMA | 89.33 | | 200 day DMA | 101.08 | EMA (exponential moving average) of Ndl Ventures NDLVENTURE_BE
| EMA period | EMA current | EMA prev | EMA prev2 | | 5 day EMA | 86.47 | 85.85 | 84.93 | | 12 day EMA | 85.38 | 84.96 | 84.46 | | 20 day EMA | 84.91 | 84.62 | 84.3 | | 35 day EMA | 84.8 | 84.63 | 84.45 | | 50 day EMA | 84.89 | 84.78 | 84.66 |
SMA (simple moving average) of Ndl Ventures NDLVENTURE_BE
| SMA period | SMA current | SMA prev | SMA prev2 | | 5 day SMA | 86.14 | 85.69 | 85.13 | | 12 day SMA | 84.78 | 84.4 | 84.03 | | 20 day SMA | 84.42 | 84.3 | 84.02 | | 35 day SMA | 84.52 | 84.55 | 84.52 | | 50 day SMA | 85.76 | 85.84 | 85.83 | | 100 day SMA | 74.87 | 74.59 | 74.31 | | 150 day SMA | 89.33 | 89.67 | 90.06 | | 200 day SMA | 101.08 | 101.27 | 101.45 |
|
|
