MohitIndustries MOHITIND_BE full analysis,charts,indicators,moving averages,SMA,DMA,EMA,ADX,MACD,RSIMohit Industries MOHITIND_BE WideScreen charts, DMA,SMA,EMA technical analysis, forecast prediction, by indicators ADX,MACD,RSI,CCI NSE stock exchange
Daily price and charts and targets MohitIndustries Strong Daily Stock price targets for MohitIndustries MOHITIND_BE are 32.18 and 34.93 | Daily Target 1 | 29.98 | | Daily Target 2 | 31.62 | | Daily Target 3 | 32.733333333333 | | Daily Target 4 | 34.37 | | Daily Target 5 | 35.48 |
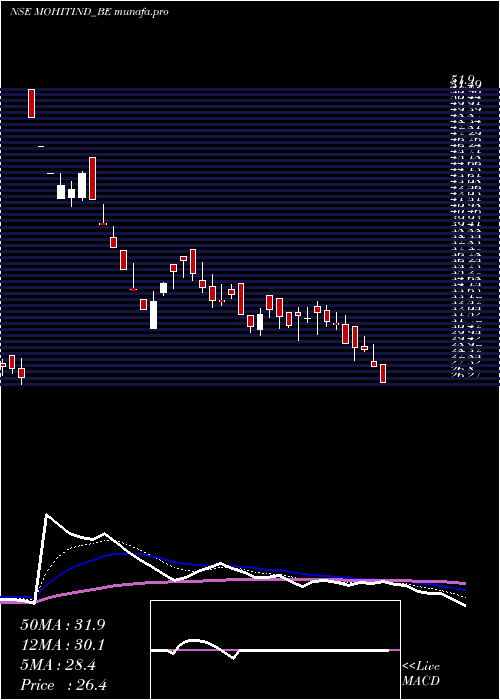
Daily price and volume Mohit Industries
| Date |
Closing |
Open |
Range |
Volume |
Tue 04 November 2025 |
33.25 (2.72%) |
31.10 |
31.10 - 33.85 |
1.7427 times |
Mon 03 November 2025 |
32.37 (-3.11%) |
33.68 |
32.16 - 33.68 |
0.8131 times |
Fri 31 October 2025 |
33.41 (-0.95%) |
33.89 |
32.66 - 33.89 |
1.1762 times |
Thu 30 October 2025 |
33.73 (1.11%) |
33.30 |
32.01 - 33.95 |
1.7541 times |
Wed 29 October 2025 |
33.36 (1.49%) |
32.88 |
32.55 - 33.89 |
1.475 times |
Tue 28 October 2025 |
32.87 (-2.84%) |
33.10 |
32.31 - 33.95 |
1.4212 times |
Mon 27 October 2025 |
33.83 (2.39%) |
33.00 |
32.25 - 34.00 |
0.5591 times |
Fri 24 October 2025 |
33.04 (-0.03%) |
33.90 |
32.50 - 33.90 |
0.5932 times |
Thu 23 October 2025 |
33.05 (0.95%) |
32.15 |
32.15 - 33.70 |
0.3817 times |
Tue 21 October 2025 |
32.74 (1.33%) |
33.00 |
32.31 - 33.00 |
0.0836 times |
Mon 20 October 2025 |
32.31 (-1.61%) |
32.25 |
31.50 - 32.83 |
0.3871 times |
Weekly price and charts MohitIndustries Strong weekly Stock price targets for MohitIndustries MOHITIND_BE are 30.8 and 33.55 | Weekly Target 1 | 29.98 | | Weekly Target 2 | 31.62 | | Weekly Target 3 | 32.733333333333 | | Weekly Target 4 | 34.37 | | Weekly Target 5 | 35.48 |
Weekly price and volumes for Mohit Industries
| Date |
Closing |
Open |
Range |
Volume |
Tue 04 November 2025 |
33.25 (-0.48%) |
33.68 |
31.10 - 33.85 |
0.6615 times |
Fri 31 October 2025 |
33.41 (1.12%) |
33.00 |
32.01 - 34.00 |
1.6529 times |
Fri 24 October 2025 |
33.04 (0.61%) |
32.25 |
31.50 - 33.90 |
0.3742 times |
Fri 17 October 2025 |
32.84 (0.03%) |
32.85 |
31.50 - 33.85 |
0.8078 times |
Fri 10 October 2025 |
32.83 (-0.85%) |
33.50 |
31.45 - 34.45 |
1.0658 times |
Fri 03 October 2025 |
33.11 (0.39%) |
32.25 |
31.55 - 34.50 |
0.4437 times |
Fri 26 September 2025 |
32.98 (0.52%) |
31.16 |
31.16 - 34.75 |
1.7324 times |
Fri 19 September 2025 |
32.81 (13.18%) |
35.00 |
32.80 - 37.65 |
1.6107 times |
Fri 02 May 2025 |
28.99 (0.31%) |
27.51 |
27.51 - 29.79 |
0.5082 times |
Fri 25 April 2025 |
28.90 (1.4%) |
28.50 |
28.08 - 30.45 |
1.1429 times |
Thu 17 April 2025 |
28.50 (0.99%) |
28.22 |
28.22 - 28.78 |
0.0376 times |

Monthly price and charts MohitIndustries Strong monthly Stock price targets for MohitIndustries MOHITIND_BE are 30.8 and 33.55 | Monthly Target 1 | 29.98 | | Monthly Target 2 | 31.62 | | Monthly Target 3 | 32.733333333333 | | Monthly Target 4 | 34.37 | | Monthly Target 5 | 35.48 |
Monthly price and volumes Mohit Industries
| Date |
Closing |
Open |
Range |
Volume |
Tue 04 November 2025 |
33.25 (-0.48%) |
33.68 |
31.10 - 33.85 |
0.1628 times |
Fri 31 October 2025 |
33.41 (1.43%) |
33.50 |
31.45 - 34.45 |
1.0103 times |
Tue 30 September 2025 |
32.94 (13.63%) |
35.00 |
31.16 - 37.65 |
0.8819 times |
Fri 02 May 2025 |
28.99 (1.43%) |
28.58 |
28.00 - 29.30 |
0.036 times |
Wed 30 April 2025 |
28.58 (6.8%) |
26.66 |
26.66 - 30.45 |
0.5589 times |
Fri 28 March 2025 |
26.76 (2.41%) |
26.13 |
24.82 - 31.29 |
0.8912 times |
Fri 28 February 2025 |
26.13 (-18.8%) |
32.49 |
23.90 - 33.49 |
1.5308 times |
Fri 31 January 2025 |
32.18 (-27.86%) |
42.37 |
30.50 - 46.00 |
4.2624 times |
Tue 31 December 2024 |
44.61 (66.33%) |
51.90 |
44.61 - 51.90 |
0.41 times |
Mon 07 October 2024 |
26.82 (-5.96%) |
28.71 |
26.27 - 28.72 |
0.2557 times |
Mon 30 September 2024 |
28.52 (4.05%) |
27.79 |
26.11 - 29.85 |
2.9569 times |

DMA SMA EMA moving averages of Mohit Industries MOHITIND_BE
DMA (daily moving average) of Mohit Industries MOHITIND_BE
| DMA period | DMA value | | 5 day DMA | 33.22 | | 12 day DMA | 33.07 | | 20 day DMA | 32.97 | | 35 day DMA | 32.71 | | 50 day DMA | 31.44 | | 100 day DMA | 30.61 | | 150 day DMA | 30.84 | | 200 day DMA | 29.33 | EMA (exponential moving average) of Mohit Industries MOHITIND_BE
| EMA period | EMA current | EMA prev | EMA prev2 | | 5 day EMA | 33.11 | 33.04 | 33.38 | | 12 day EMA | 33.06 | 33.03 | 33.15 | | 20 day EMA | 32.87 | 32.83 | 32.88 | | 35 day EMA | 32.06 | 31.99 | 31.97 | | 50 day EMA | 31.33 | 31.25 | 31.2 |
SMA (simple moving average) of Mohit Industries MOHITIND_BE
| SMA period | SMA current | SMA prev | SMA prev2 | | 5 day SMA | 33.22 | 33.15 | 33.44 | | 12 day SMA | 33.07 | 32.97 | 33 | | 20 day SMA | 32.97 | 32.91 | 32.95 | | 35 day SMA | 32.71 | 32.59 | 32.49 | | 50 day SMA | 31.44 | 31.31 | 31.2 | | 100 day SMA | 30.61 | 30.63 | 30.64 | | 150 day SMA | 30.84 | 30.78 | 30.73 | | 200 day SMA | 29.33 | 29.26 | 29.19 |
|
|
