ManglamInfra MIEL_ST full analysis,charts,indicators,moving averages,SMA,DMA,EMA,ADX,MACD,RSIManglam Infra MIEL_ST WideScreen charts, DMA,SMA,EMA technical analysis, forecast prediction, by indicators ADX,MACD,RSI,CCI NSE stock exchange
Daily price and charts and targets ManglamInfra Strong Daily Stock price targets for ManglamInfra MIEL_ST are 21.8 and 21.8 | Daily Target 1 | 21.8 | | Daily Target 2 | 21.8 | | Daily Target 3 | 21.8 | | Daily Target 4 | 21.8 | | Daily Target 5 | 21.8 |
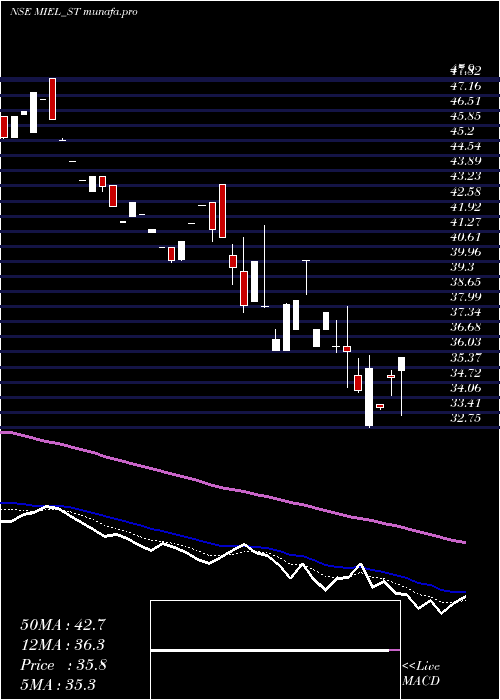
Daily price and volume Manglam Infra
| Date |
Closing |
Open |
Range |
Volume |
Tue 04 November 2025 |
21.80 (-4.8%) |
21.80 |
21.80 - 21.80 |
0.3125 times |
Mon 03 November 2025 |
22.90 (0%) |
22.90 |
22.90 - 22.90 |
0.1563 times |
Fri 31 October 2025 |
22.90 (1.33%) |
21.55 |
21.55 - 22.90 |
1.7188 times |
Thu 30 October 2025 |
22.60 (-1.74%) |
22.00 |
21.85 - 22.60 |
0.625 times |
Wed 29 October 2025 |
23.00 (4.07%) |
22.10 |
22.00 - 23.00 |
0.4688 times |
Tue 28 October 2025 |
22.10 (4.99%) |
22.05 |
22.05 - 22.10 |
0.4688 times |
Fri 24 October 2025 |
21.05 (-1.86%) |
21.05 |
21.05 - 21.05 |
0.1563 times |
Thu 23 October 2025 |
21.45 (-0.92%) |
21.45 |
21.45 - 21.45 |
0.3125 times |
Mon 20 October 2025 |
21.65 (-3.99%) |
21.50 |
21.50 - 21.65 |
0.3125 times |
Fri 17 October 2025 |
22.55 (4.88%) |
21.65 |
20.45 - 22.55 |
5.4688 times |
Thu 16 October 2025 |
21.50 (0%) |
21.50 |
21.40 - 21.50 |
0.4688 times |
Weekly price and charts ManglamInfra Strong weekly Stock price targets for ManglamInfra MIEL_ST are 21.25 and 22.35 | Weekly Target 1 | 21.07 | | Weekly Target 2 | 21.43 | | Weekly Target 3 | 22.166666666667 | | Weekly Target 4 | 22.53 | | Weekly Target 5 | 23.27 |
Weekly price and volumes for Manglam Infra
| Date |
Closing |
Open |
Range |
Volume |
Tue 04 November 2025 |
21.80 (-4.8%) |
22.90 |
21.80 - 22.90 |
0.1604 times |
Fri 31 October 2025 |
22.90 (8.79%) |
22.05 |
21.55 - 23.00 |
1.123 times |
Fri 24 October 2025 |
21.05 (-6.65%) |
21.50 |
21.05 - 21.65 |
0.2674 times |
Fri 17 October 2025 |
22.55 (-0.22%) |
23.00 |
20.45 - 23.00 |
2.7807 times |
Thu 09 October 2025 |
22.60 (-3.83%) |
23.50 |
22.00 - 23.50 |
0.9626 times |
Fri 03 October 2025 |
23.50 (-4.47%) |
24.50 |
23.50 - 25.30 |
0.6952 times |
Fri 26 September 2025 |
24.60 (-1.99%) |
23.95 |
23.50 - 25.90 |
0.8556 times |
Fri 19 September 2025 |
25.10 (-3.83%) |
25.10 |
24.90 - 26.15 |
0.8021 times |
Fri 12 September 2025 |
26.10 (27.94%) |
29.40 |
26.10 - 29.40 |
1.6578 times |
Fri 01 August 2025 |
20.40 (-8.31%) |
21.55 |
20.40 - 22.00 |
0.6952 times |
Fri 25 July 2025 |
22.25 (-3.89%) |
24.15 |
21.05 - 24.15 |
3.9037 times |

Monthly price and charts ManglamInfra Strong monthly Stock price targets for ManglamInfra MIEL_ST are 21.25 and 22.35 | Monthly Target 1 | 21.07 | | Monthly Target 2 | 21.43 | | Monthly Target 3 | 22.166666666667 | | Monthly Target 4 | 22.53 | | Monthly Target 5 | 23.27 |
Monthly price and volumes Manglam Infra
| Date |
Closing |
Open |
Range |
Volume |
Tue 04 November 2025 |
21.80 (-4.8%) |
22.90 |
21.80 - 22.90 |
0.0158 times |
Fri 31 October 2025 |
22.90 (-2.55%) |
24.65 |
20.45 - 25.30 |
0.5518 times |
Mon 29 September 2025 |
23.50 (15.2%) |
29.40 |
23.50 - 29.40 |
0.3468 times |
Fri 01 August 2025 |
20.40 (-3.09%) |
20.50 |
20.40 - 21.30 |
0.0263 times |
Wed 30 July 2025 |
21.05 (-6.03%) |
22.50 |
20.80 - 24.15 |
0.7304 times |
Mon 30 June 2025 |
22.40 (-20.14%) |
26.65 |
20.90 - 26.65 |
1.2034 times |
Fri 30 May 2025 |
28.05 (0.18%) |
27.45 |
24.25 - 28.05 |
0.4256 times |
Wed 30 April 2025 |
28.00 (29.63%) |
22.65 |
20.00 - 30.35 |
1.1193 times |
Fri 28 March 2025 |
21.60 (-21.88%) |
26.90 |
21.15 - 28.85 |
2.9795 times |
Fri 28 February 2025 |
27.65 (-30.88%) |
36.25 |
27.65 - 38.00 |
2.6012 times |
Fri 31 January 2025 |
40.00 (-7.94%) |
43.00 |
36.10 - 43.65 |
1.0405 times |

DMA SMA EMA moving averages of Manglam Infra MIEL_ST
DMA (daily moving average) of Manglam Infra MIEL_ST
| DMA period | DMA value | | 5 day DMA | 22.64 | | 12 day DMA | 22.08 | | 20 day DMA | 22.36 | | 35 day DMA | 23.67 | | 50 day DMA | 23.26 | | 100 day DMA | 23.93 | | 150 day DMA | 25.25 | | 200 day DMA | 29.96 | EMA (exponential moving average) of Manglam Infra MIEL_ST
| EMA period | EMA current | EMA prev | EMA prev2 | | 5 day EMA | 22.36 | 22.64 | 22.51 | | 12 day EMA | 22.38 | 22.49 | 22.41 | | 20 day EMA | 22.6 | 22.68 | 22.66 | | 35 day EMA | 22.73 | 22.79 | 22.78 | | 50 day EMA | 23.14 | 23.19 | 23.2 |
SMA (simple moving average) of Manglam Infra MIEL_ST
| SMA period | SMA current | SMA prev | SMA prev2 | | 5 day SMA | 22.64 | 22.7 | 22.33 | | 12 day SMA | 22.08 | 22.1 | 22.08 | | 20 day SMA | 22.36 | 22.45 | 22.53 | | 35 day SMA | 23.67 | 23.65 | 23.61 | | 50 day SMA | 23.26 | 23.27 | 23.24 | | 100 day SMA | 23.93 | 24.02 | 24.08 | | 150 day SMA | 25.25 | 25.36 | 25.46 | | 200 day SMA | 29.96 | 30.06 | 30.17 |
|
|
