MasonInfratech MASON_ST full analysis,charts,indicators,moving averages,SMA,DMA,EMA,ADX,MACD,RSIMason Infratech MASON_ST WideScreen charts, DMA,SMA,EMA technical analysis, forecast prediction, by indicators ADX,MACD,RSI,CCI NSE stock exchange
Daily price and charts and targets MasonInfratech Strong Daily Stock price targets for MasonInfratech MASON_ST are 201.88 and 206.63 | Daily Target 1 | 198.17 | | Daily Target 2 | 200.83 | | Daily Target 3 | 202.91666666667 | | Daily Target 4 | 205.58 | | Daily Target 5 | 207.67 |
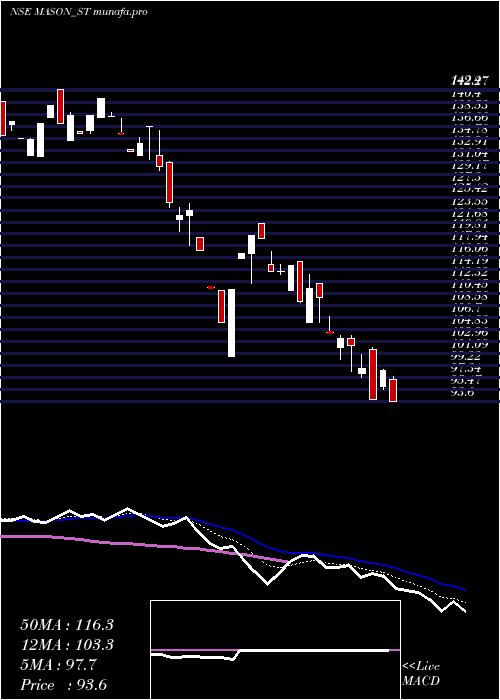
Daily price and volume Mason Infratech
| Date |
Closing |
Open |
Range |
Volume |
Fri 29 August 2025 |
203.50 (-2.16%) |
200.25 |
200.25 - 205.00 |
0.8203 times |
Thu 28 August 2025 |
208.00 (1.04%) |
205.85 |
198.05 - 208.00 |
1.0156 times |
Tue 26 August 2025 |
205.85 (-2.9%) |
205.00 |
201.40 - 208.00 |
2.1875 times |
Mon 25 August 2025 |
212.00 (3.09%) |
205.70 |
205.70 - 215.90 |
1.7578 times |
Fri 22 August 2025 |
205.65 (1.98%) |
205.65 |
205.60 - 205.65 |
0.5859 times |
Thu 21 August 2025 |
201.65 (2%) |
201.65 |
201.65 - 201.65 |
1.2109 times |
Wed 20 August 2025 |
197.70 (-1.98%) |
199.00 |
197.70 - 199.00 |
0.625 times |
Tue 19 August 2025 |
201.70 (-1.99%) |
205.75 |
201.70 - 205.75 |
0.3906 times |
Mon 18 August 2025 |
205.80 (-2%) |
205.85 |
205.80 - 206.00 |
0.2344 times |
Thu 14 August 2025 |
210.00 (0.96%) |
207.25 |
204.00 - 210.00 |
1.1719 times |
Wed 13 August 2025 |
208.00 (0.14%) |
207.80 |
205.00 - 208.00 |
1.3281 times |
Weekly price and charts MasonInfratech Strong weekly Stock price targets for MasonInfratech MASON_ST are 191.85 and 209.7 | Weekly Target 1 | 187.97 | | Weekly Target 2 | 195.73 | | Weekly Target 3 | 205.81666666667 | | Weekly Target 4 | 213.58 | | Weekly Target 5 | 223.67 |
Weekly price and volumes for Mason Infratech
| Date |
Closing |
Open |
Range |
Volume |
Fri 29 August 2025 |
203.50 (-1.05%) |
205.70 |
198.05 - 215.90 |
0.7034 times |
Fri 22 August 2025 |
205.65 (-2.07%) |
205.85 |
197.70 - 206.00 |
0.3707 times |
Thu 14 August 2025 |
210.00 (-0.9%) |
210.00 |
204.00 - 210.00 |
0.5751 times |
Fri 08 August 2025 |
211.90 (3.97%) |
205.80 |
204.00 - 214.00 |
0.8413 times |
Fri 01 August 2025 |
203.80 (0.12%) |
205.00 |
198.00 - 206.50 |
0.6131 times |
Fri 25 July 2025 |
203.55 (8.56%) |
186.50 |
186.50 - 203.80 |
1.2452 times |
Fri 18 July 2025 |
187.50 (10.33%) |
173.30 |
173.30 - 187.50 |
2.2196 times |
Fri 11 July 2025 |
169.95 (-5.92%) |
177.05 |
166.65 - 177.05 |
1.1074 times |
Fri 04 July 2025 |
180.65 (6.05%) |
173.75 |
173.75 - 186.95 |
1.3023 times |
Fri 27 June 2025 |
170.35 (6.37%) |
160.10 |
160.00 - 170.35 |
1.0219 times |
Fri 20 June 2025 |
160.15 (21.46%) |
132.00 |
132.00 - 162.80 |
3.2937 times |

Monthly price and charts MasonInfratech Strong monthly Stock price targets for MasonInfratech MASON_ST are 191.5 and 209.7 | Monthly Target 1 | 187.5 | | Monthly Target 2 | 195.5 | | Monthly Target 3 | 205.7 | | Monthly Target 4 | 213.7 | | Monthly Target 5 | 223.9 |
Monthly price and volumes Mason Infratech
| Date |
Closing |
Open |
Range |
Volume |
Fri 29 August 2025 |
203.50 (-0.1%) |
204.00 |
197.70 - 215.90 |
0.4957 times |
Thu 31 July 2025 |
203.70 (17.24%) |
177.20 |
166.65 - 206.50 |
1.2228 times |
Mon 30 June 2025 |
173.75 (39.39%) |
125.80 |
112.10 - 173.75 |
1.0667 times |
Fri 30 May 2025 |
124.65 (26.87%) |
120.00 |
115.00 - 130.50 |
0.235 times |
Fri 21 February 2025 |
98.25 (-17.78%) |
121.50 |
93.60 - 121.50 |
0.2378 times |
Fri 31 January 2025 |
119.50 (-11.28%) |
132.05 |
100.60 - 142.40 |
0.3351 times |
Tue 31 December 2024 |
134.70 (17.18%) |
113.05 |
113.00 - 143.65 |
0.3433 times |
Fri 29 November 2024 |
114.95 (-6.09%) |
122.50 |
112.25 - 126.40 |
0.1781 times |
Fri 12 July 2024 |
122.40 (0%) |
88.00 |
83.60 - 129.80 |
4.8856 times |
Sat 30 August 2025 |
(0%) |
|
- |
0 times |

DMA SMA EMA moving averages of Mason Infratech MASON_ST
DMA (daily moving average) of Mason Infratech MASON_ST
| DMA period | DMA value | | 5 day DMA | 207 | | 12 day DMA | 205.63 | | 20 day DMA | 206.93 | | 35 day DMA | 199.39 | | 50 day DMA | 190.8 | | 100 day DMA | 155.11 | | 150 day DMA | | | 200 day DMA | | EMA (exponential moving average) of Mason Infratech MASON_ST
| EMA period | EMA current | EMA prev | EMA prev2 | | 5 day EMA | 205.72 | 206.83 | 206.24 | | 12 day EMA | 205.61 | 205.99 | 205.63 | | 20 day EMA | 203.74 | 203.77 | 203.33 | | 35 day EMA | 196.28 | 195.85 | 195.13 | | 50 day EMA | 188.2 | 187.58 | 186.75 |
SMA (simple moving average) of Mason Infratech MASON_ST
| SMA period | SMA current | SMA prev | SMA prev2 | | 5 day SMA | 207 | 206.63 | 204.57 | | 12 day SMA | 205.63 | 205.98 | 206.3 | | 20 day SMA | 206.93 | 206.95 | 206.65 | | 35 day SMA | 199.39 | 198.43 | 197.45 | | 50 day SMA | 190.8 | 189.78 | 188.52 | | 100 day SMA | 155.11 | 154.43 | 153.73 | | 150 day SMA | | 200 day SMA |
|
|
