KbcGlobal KBCGLOBAL full analysis,charts,indicators,moving averages,SMA,DMA,EMA,ADX,MACD,RSIKbc Global KBCGLOBAL WideScreen charts, DMA,SMA,EMA technical analysis, forecast prediction, by indicators ADX,MACD,RSI,CCI NSE stock exchange
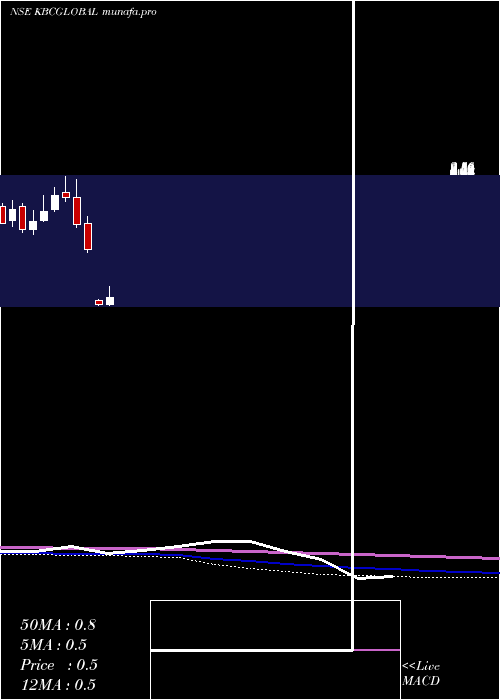
Daily price and charts and targets KbcGlobal Strong Daily Stock price targets for KbcGlobal KBCGLOBAL are 0.48 and 0.51 | Daily Target 1 | 0.46 | | Daily Target 2 | 0.48 | | Daily Target 3 | 0.49333333333333 | | Daily Target 4 | 0.51 | | Daily Target 5 | 0.52 |
Daily price and volume Kbc Global
| Date |
Closing |
Open |
Range |
Volume |
Fri 20 June 2025 |
0.49 (0%) |
0.49 |
0.48 - 0.51 |
0.8625 times |
Thu 19 June 2025 |
0.49 (-10.91%) |
0.54 |
0.49 - 0.57 |
1.409 times |
Wed 18 June 2025 |
0.55 (-11.29%) |
0.62 |
0.55 - 0.67 |
2.0189 times |
Tue 17 June 2025 |
0.62 (19.23%) |
0.61 |
0.58 - 0.62 |
1.3424 times |
Mon 16 June 2025 |
0.52 (18.18%) |
0.46 |
0.46 - 0.52 |
1.1479 times |
Fri 13 June 2025 |
0.44 (-2.22%) |
0.43 |
0.41 - 0.49 |
1.3303 times |
Thu 12 June 2025 |
0.45 (18.42%) |
0.39 |
0.38 - 0.45 |
1.2304 times |
Wed 11 June 2025 |
0.38 (0%) |
0.38 |
0.38 - 0.39 |
0.2942 times |
Tue 10 June 2025 |
0.38 (0%) |
0.39 |
0.37 - 0.39 |
0.1766 times |
Mon 09 June 2025 |
0.38 (2.7%) |
0.37 |
0.37 - 0.39 |
0.1877 times |
Fri 06 June 2025 |
0.37 (2.78%) |
0.37 |
0.36 - 0.38 |
0.339 times |
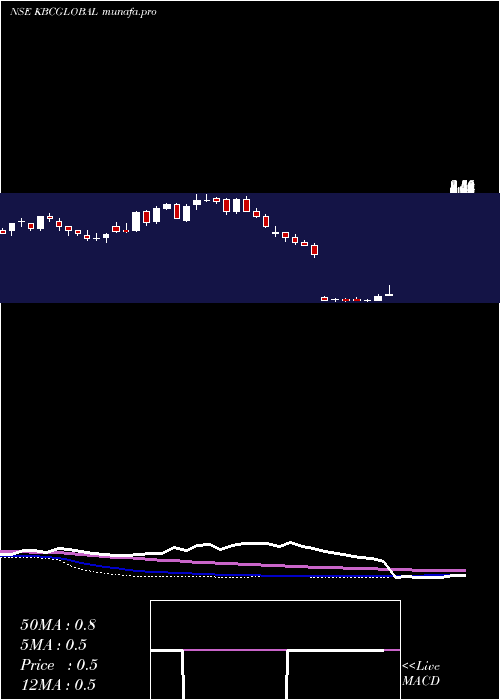
Weekly price and charts KbcGlobal Strong weekly Stock price targets for KbcGlobal KBCGLOBAL are 0.48 and 0.69 | Weekly Target 1 | 0.33 | | Weekly Target 2 | 0.41 | | Weekly Target 3 | 0.54 | | Weekly Target 4 | 0.62 | | Weekly Target 5 | 0.75 |
Weekly price and volumes for Kbc Global
| Date |
Closing |
Open |
Range |
Volume |
Fri 20 June 2025 |
0.49 (11.36%) |
0.46 |
0.46 - 0.67 |
3.7982 times |
Fri 13 June 2025 |
0.44 (18.92%) |
0.37 |
0.37 - 0.49 |
1.8033 times |
Fri 06 June 2025 |
0.37 (0%) |
0.36 |
0.35 - 0.38 |
0.6478 times |
Fri 30 May 2025 |
0.37 (0%) |
0.38 |
0.36 - 0.42 |
0.9576 times |
Fri 23 May 2025 |
0.37 (-5.13%) |
0.39 |
0.34 - 0.40 |
0.6345 times |
Fri 16 May 2025 |
0.39 (5.41%) |
0.38 |
0.34 - 0.41 |
0.9061 times |
Fri 09 May 2025 |
0.37 (-71.76%) |
0.43 |
0.36 - 0.45 |
0.471 times |
Wed 29 January 2025 |
1.31 (-12.67%) |
1.50 |
1.26 - 1.54 |
0.33 times |
Fri 24 January 2025 |
1.50 (-3.85%) |
1.56 |
1.49 - 1.60 |
0.2171 times |
Fri 17 January 2025 |
1.56 (-6.02%) |
1.66 |
1.52 - 1.72 |
0.2342 times |
Fri 10 January 2025 |
1.66 (-6.21%) |
1.77 |
1.58 - 1.77 |
0.2288 times |
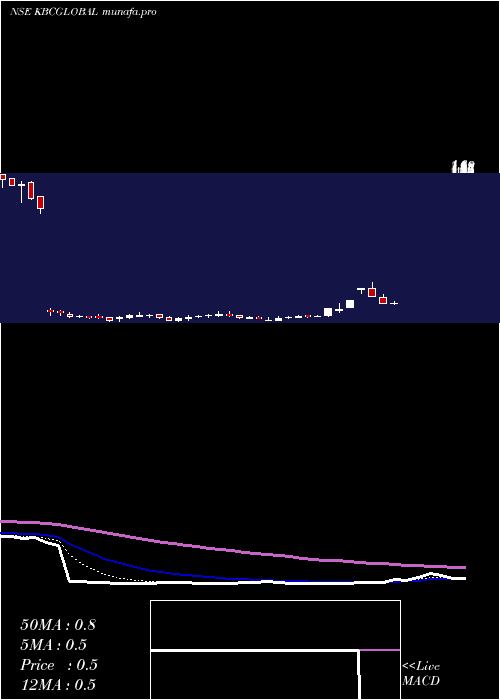
Monthly price and charts KbcGlobal Strong monthly Stock price targets for KbcGlobal KBCGLOBAL are 0.42 and 0.74 | Monthly Target 1 | 0.18 | | Monthly Target 2 | 0.34 | | Monthly Target 3 | 0.50333333333333 | | Monthly Target 4 | 0.66 | | Monthly Target 5 | 0.82 |
Monthly price and volumes Kbc Global
| Date |
Closing |
Open |
Range |
Volume |
Fri 20 June 2025 |
0.49 (32.43%) |
0.36 |
0.35 - 0.67 |
3.335 times |
Fri 30 May 2025 |
0.37 (-71.76%) |
0.43 |
0.34 - 0.45 |
1.5845 times |
Wed 29 January 2025 |
1.31 (-24.28%) |
1.75 |
1.26 - 1.88 |
0.6673 times |
Tue 31 December 2024 |
1.73 (-21.72%) |
2.21 |
1.69 - 2.51 |
0.7958 times |
Fri 29 November 2024 |
2.21 (-0.9%) |
2.29 |
2.14 - 2.56 |
0.7901 times |
Thu 31 October 2024 |
2.23 (13.2%) |
2.00 |
1.97 - 2.37 |
0.9006 times |
Mon 15 July 2024 |
1.97 (10.06%) |
1.80 |
1.79 - 2.23 |
0.5241 times |
Fri 28 June 2024 |
1.79 (8.48%) |
1.65 |
1.57 - 1.98 |
0.6696 times |
Fri 31 May 2024 |
1.65 (-17.5%) |
2.05 |
1.60 - 2.10 |
0.2946 times |
Tue 30 April 2024 |
2.00 (14.29%) |
1.80 |
1.70 - 2.15 |
0.4384 times |
Thu 28 March 2024 |
1.75 (-12.5%) |
2.00 |
1.75 - 2.20 |
0.2472 times |
DMA SMA EMA moving averages of Kbc Global KBCGLOBAL
DMA (daily moving average) of Kbc Global KBCGLOBAL
| DMA period | DMA value | | 5 day DMA | 0.53 | | 12 day DMA | 0.45 | | 20 day DMA | 0.42 | | 35 day DMA | 0.4 | | 50 day DMA | 0.75 | | 100 day DMA | 1.47 | | 150 day DMA | 1.62 | | 200 day DMA | 1.69 | EMA (exponential moving average) of Kbc Global KBCGLOBAL
| EMA period | EMA current | EMA prev | EMA prev2 | | 5 day EMA | 0.5 | 0.51 | 0.52 | | 12 day EMA | 0.47 | 0.47 | 0.47 | | 20 day EMA | 0.48 | 0.48 | 0.48 | | 35 day EMA | 0.64 | 0.65 | 0.66 | | 50 day EMA | 0.82 | 0.83 | 0.84 |
SMA (simple moving average) of Kbc Global KBCGLOBAL
| SMA period | SMA current | SMA prev | SMA prev2 | | 5 day SMA | 0.53 | 0.52 | 0.52 | | 12 day SMA | 0.45 | 0.44 | 0.43 | | 20 day SMA | 0.42 | 0.42 | 0.41 | | 35 day SMA | 0.4 | 0.43 | 0.45 | | 50 day SMA | 0.75 | 0.77 | 0.79 | | 100 day SMA | 1.47 | 1.49 | 1.5 | | 150 day SMA | 1.62 | 1.63 | 1.64 | | 200 day SMA | 1.69 | 1.7 | 1.71 |
|
|
