Itc ITC_BL full analysis,charts,indicators,moving averages,SMA,DMA,EMA,ADX,MACD,RSIItc ITC_BL WideScreen charts, DMA,SMA,EMA technical analysis, forecast prediction, by indicators ADX,MACD,RSI,CCI NSE stock exchange
Daily price and charts and targets Itc Strong Daily Stock price targets for Itc ITC_BL are 407.1 and 407.1 | Daily Target 1 | 407.1 | | Daily Target 2 | 407.1 | | Daily Target 3 | 407.1 | | Daily Target 4 | 407.1 | | Daily Target 5 | 407.1 |
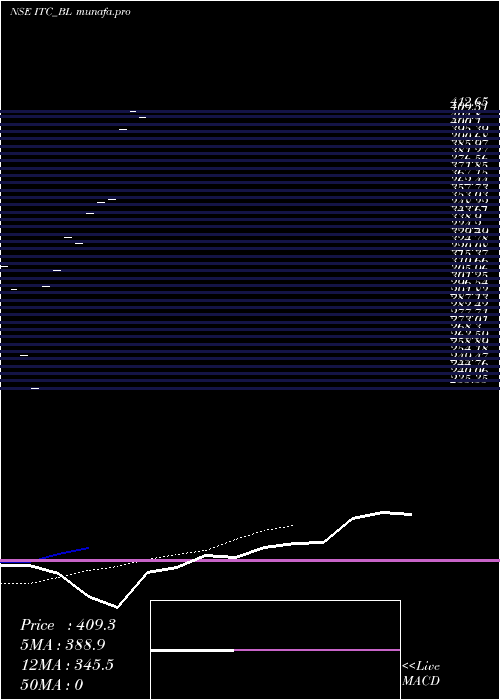
Daily price and volume Itc
| Date |
Closing |
Open |
Range |
Volume |
Tue 18 November 2025 |
407.10 (-0.54%) |
407.10 |
407.10 - 407.10 |
6.29 times |
Thu 18 September 2025 |
409.30 (-0.81%) |
409.30 |
409.30 - 409.30 |
0.0853 times |
Tue 16 September 2025 |
412.65 (2.75%) |
412.65 |
412.65 - 412.65 |
0.0782 times |
Fri 28 February 2025 |
401.60 (12.7%) |
401.60 |
401.60 - 401.60 |
0.3512 times |
Mon 14 November 2022 |
356.35 (0.48%) |
356.35 |
356.35 - 356.35 |
0.609 times |
Thu 03 November 2022 |
354.65 (2%) |
354.65 |
354.65 - 354.65 |
0.609 times |
Tue 25 October 2022 |
347.70 (6.05%) |
347.70 |
347.70 - 347.70 |
0.3276 times |
Tue 11 October 2022 |
327.85 (-1.31%) |
327.85 |
327.85 - 327.85 |
0.5035 times |
Mon 03 October 2022 |
332.20 (6.87%) |
332.20 |
332.20 - 332.20 |
0.5038 times |
Mon 08 August 2022 |
310.85 (3.43%) |
310.85 |
310.85 - 310.85 |
0.6423 times |
Mon 25 July 2022 |
300.55 (27.7%) |
300.55 |
300.55 - 300.55 |
0.6423 times |
Weekly price and charts Itc Strong weekly Stock price targets for Itc ITC_BL are 407.1 and 407.1 | Weekly Target 1 | 407.1 | | Weekly Target 2 | 407.1 | | Weekly Target 3 | 407.1 | | Weekly Target 4 | 407.1 | | Weekly Target 5 | 407.1 |
Weekly price and volumes for Itc
| Date |
Closing |
Open |
Range |
Volume |
Tue 18 November 2025 |
407.10 (-0.54%) |
407.10 |
407.10 - 407.10 |
4.5727 times |
Thu 18 September 2025 |
409.30 (1.92%) |
412.65 |
409.30 - 412.65 |
0.1189 times |
Fri 28 February 2025 |
401.60 (13.24%) |
356.35 |
356.35 - 401.60 |
0.698 times |
Thu 03 November 2022 |
354.65 (8.17%) |
347.70 |
347.70 - 354.65 |
0.6809 times |
Tue 11 October 2022 |
327.85 (5.47%) |
332.20 |
327.85 - 332.20 |
0.7323 times |
Mon 08 August 2022 |
310.85 (3.43%) |
310.85 |
310.85 - 310.85 |
0.467 times |
Mon 25 July 2022 |
300.55 (27.7%) |
300.55 |
300.55 - 300.55 |
0.467 times |
Mon 04 October 2021 |
235.35 (0%) |
235.35 |
235.35 - 235.35 |
0.2633 times |
Wed 19 November 2025 |
(0%) |
|
- |
0 times |

Monthly price and charts Itc Strong monthly Stock price targets for Itc ITC_BL are 407.1 and 407.1 | Monthly Target 1 | 407.1 | | Monthly Target 2 | 407.1 | | Monthly Target 3 | 407.1 | | Monthly Target 4 | 407.1 | | Monthly Target 5 | 407.1 |
Monthly price and volumes Itc
| Date |
Closing |
Open |
Range |
Volume |
Tue 18 November 2025 |
407.10 (-0.54%) |
407.10 |
407.10 - 407.10 |
5.5927 times |
Thu 18 September 2025 |
409.30 (1.92%) |
412.65 |
409.30 - 412.65 |
0.1454 times |
Fri 28 February 2025 |
401.60 (12.7%) |
401.60 |
401.60 - 401.60 |
0.3123 times |
Mon 14 November 2022 |
356.35 (2.49%) |
354.65 |
354.65 - 356.35 |
1.083 times |
Tue 25 October 2022 |
347.70 (11.85%) |
332.20 |
327.85 - 347.70 |
1.1869 times |
Mon 08 August 2022 |
310.85 (3.43%) |
310.85 |
310.85 - 310.85 |
0.5711 times |
Mon 25 July 2022 |
300.55 (27.7%) |
300.55 |
300.55 - 300.55 |
0.5711 times |
Mon 04 October 2021 |
235.35 (-8.07%) |
235.35 |
235.35 - 235.35 |
0.322 times |
Wed 25 September 2019 |
256.00 (-14.35%) |
256.00 |
256.00 - 256.00 |
0.1339 times |
Fri 22 March 2019 |
298.90 (-4.6%) |
298.90 |
298.90 - 298.90 |
0.0815 times |
Tue 21 August 2018 |
313.30 (0%) |
313.30 |
313.30 - 313.30 |
0.8489 times |

DMA SMA EMA moving averages of Itc ITC_BL
DMA (daily moving average) of Itc ITC_BL
| DMA period | DMA value | | 5 day DMA | 397.4 | | 12 day DMA | 349.68 | | 20 day DMA | | | 35 day DMA | | | 50 day DMA | | | 100 day DMA | | | 150 day DMA | | | 200 day DMA | | EMA (exponential moving average) of Itc ITC_BL
| EMA period | EMA current | EMA prev | EMA prev2 | | 5 day EMA | 394.94 | 388.86 | 378.64 | | 12 day EMA | 354.98 | 345.51 | 333.92 | | 20 day EMA | 0 | 0 | 0 | | 35 day EMA | 0 | 0 | 0 | | 50 day EMA | 0 | 0 | 0 |
SMA (simple moving average) of Itc ITC_BL
| SMA period | SMA current | SMA prev | SMA prev2 | | 5 day SMA | 397.4 | 386.91 | 374.59 | | 12 day SMA | 349.68 | 337.09 | | 20 day SMA | | 35 day SMA | | 50 day SMA | | 100 day SMA | | 150 day SMA | | 200 day SMA |
|
|
