IrisBusiness IRIS_BE full analysis,charts,indicators,moving averages,SMA,DMA,EMA,ADX,MACD,RSIIris Business IRIS_BE WideScreen charts, DMA,SMA,EMA technical analysis, forecast prediction, by indicators ADX,MACD,RSI,CCI NSE stock exchange
Daily price and charts and targets IrisBusiness Strong Daily Stock price targets for IrisBusiness IRIS_BE are 345.53 and 363.68 | Daily Target 1 | 340.97 | | Daily Target 2 | 350.08 | | Daily Target 3 | 359.11666666667 | | Daily Target 4 | 368.23 | | Daily Target 5 | 377.27 |
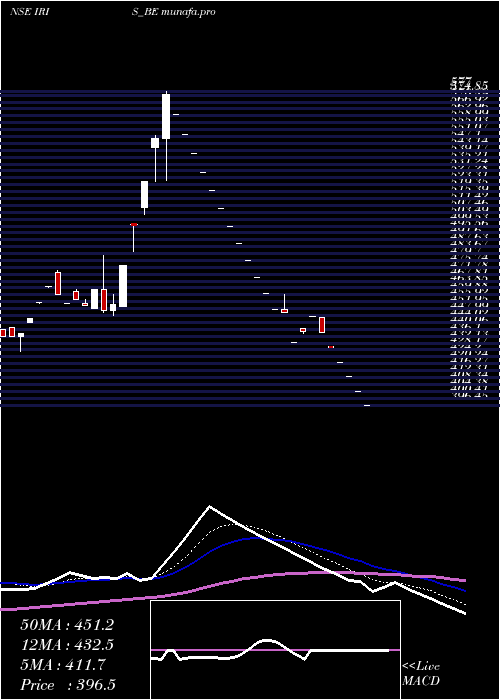
Daily price and volume Iris Business
| Date |
Closing |
Open |
Range |
Volume |
Fri 29 August 2025 |
359.20 (-0.11%) |
368.15 |
350.00 - 368.15 |
0.1045 times |
Thu 28 August 2025 |
359.60 (0.84%) |
372.60 |
350.55 - 374.40 |
0.3748 times |
Tue 26 August 2025 |
356.60 (3.59%) |
341.70 |
340.00 - 358.00 |
0.6921 times |
Mon 25 August 2025 |
344.25 (4.99%) |
327.90 |
320.15 - 344.25 |
1.0689 times |
Fri 22 August 2025 |
327.90 (0.11%) |
327.55 |
314.15 - 332.55 |
0.4142 times |
Thu 21 August 2025 |
327.55 (-1.87%) |
343.95 |
320.00 - 343.95 |
0.7026 times |
Wed 20 August 2025 |
333.80 (2.5%) |
327.00 |
317.10 - 341.90 |
0.6107 times |
Tue 19 August 2025 |
325.65 (5%) |
301.00 |
296.55 - 325.65 |
1.4035 times |
Mon 18 August 2025 |
310.15 (-4.96%) |
317.00 |
310.05 - 326.00 |
2.5995 times |
Thu 14 August 2025 |
326.35 (-4.99%) |
326.40 |
326.35 - 326.40 |
2.0292 times |
Wed 13 August 2025 |
343.50 (-3.94%) |
357.60 |
339.75 - 363.25 |
1.4715 times |
Weekly price and charts IrisBusiness Strong weekly Stock price targets for IrisBusiness IRIS_BE are 339.68 and 393.93 | Weekly Target 1 | 297 | | Weekly Target 2 | 328.1 | | Weekly Target 3 | 351.25 | | Weekly Target 4 | 382.35 | | Weekly Target 5 | 405.5 |
Weekly price and volumes for Iris Business
| Date |
Closing |
Open |
Range |
Volume |
Fri 29 August 2025 |
359.20 (9.55%) |
327.90 |
320.15 - 374.40 |
0.6606 times |
Fri 22 August 2025 |
327.90 (0.47%) |
317.00 |
296.55 - 343.95 |
1.6897 times |
Thu 14 August 2025 |
326.35 (-8.69%) |
357.40 |
326.35 - 365.00 |
1.3466 times |
Fri 08 August 2025 |
357.40 (-3.92%) |
375.00 |
350.00 - 375.00 |
0.9665 times |
Fri 01 August 2025 |
372.00 (-0.64%) |
365.00 |
363.50 - 387.00 |
0.5709 times |
Fri 25 July 2025 |
374.40 (-0.64%) |
370.00 |
362.00 - 395.00 |
0.9751 times |
Fri 18 July 2025 |
376.80 (-8.73%) |
426.95 |
375.00 - 426.95 |
1.2023 times |
Fri 11 July 2025 |
412.85 (64.91%) |
250.00 |
245.00 - 412.95 |
0.8058 times |
Fri 13 June 2025 |
250.35 (-3.21%) |
259.40 |
248.05 - 262.90 |
0.8447 times |
Fri 06 June 2025 |
258.65 (0.37%) |
259.75 |
246.05 - 264.00 |
0.9377 times |
Fri 30 May 2025 |
257.70 (3.66%) |
246.00 |
245.00 - 279.95 |
1.6826 times |

Monthly price and charts IrisBusiness Strong monthly Stock price targets for IrisBusiness IRIS_BE are 287.43 and 368.33 | Monthly Target 1 | 263.5 | | Monthly Target 2 | 311.35 | | Monthly Target 3 | 344.4 | | Monthly Target 4 | 392.25 | | Monthly Target 5 | 425.3 |
Monthly price and volumes Iris Business
| Date |
Closing |
Open |
Range |
Volume |
Fri 29 August 2025 |
359.20 (-2.68%) |
366.00 |
296.55 - 377.45 |
1.2791 times |
Thu 31 July 2025 |
369.10 (49.92%) |
389.35 |
362.00 - 426.95 |
0.9046 times |
Mon 16 June 2025 |
246.20 (-4.46%) |
259.75 |
245.00 - 264.00 |
0.5272 times |
Fri 30 May 2025 |
257.70 (-3.07%) |
252.55 |
228.05 - 300.70 |
2.1934 times |
Wed 30 April 2025 |
265.85 (-29.4%) |
369.05 |
265.85 - 369.05 |
0.7072 times |
Fri 28 March 2025 |
376.55 (0.83%) |
387.00 |
352.40 - 438.90 |
0.6859 times |
Fri 28 February 2025 |
373.45 (-17.01%) |
432.20 |
333.40 - 447.45 |
0.5272 times |
Fri 31 January 2025 |
450.00 (-1.1%) |
462.00 |
448.00 - 577.00 |
1.3422 times |
Tue 31 December 2024 |
455.00 (8.02%) |
425.00 |
425.00 - 478.30 |
0.4532 times |
Fri 29 November 2024 |
421.20 (10.51%) |
400.20 |
385.00 - 441.20 |
1.3799 times |
Thu 31 October 2024 |
381.15 (11.92%) |
347.35 |
313.65 - 387.60 |
1.2027 times |

DMA SMA EMA moving averages of Iris Business IRIS_BE
DMA (daily moving average) of Iris Business IRIS_BE
| DMA period | DMA value | | 5 day DMA | 349.51 | | 12 day DMA | 339.35 | | 20 day DMA | 349.89 | | 35 day DMA | 361.34 | | 50 day DMA | 330.44 | | 100 day DMA | 330.56 | | 150 day DMA | 369.68 | | 200 day DMA | 377.99 | EMA (exponential moving average) of Iris Business IRIS_BE
| EMA period | EMA current | EMA prev | EMA prev2 | | 5 day EMA | 351.59 | 347.78 | 341.87 | | 12 day EMA | 347.16 | 344.97 | 342.31 | | 20 day EMA | 347.11 | 345.84 | 344.39 | | 35 day EMA | 334.95 | 333.52 | 331.98 | | 50 day EMA | 326.11 | 324.76 | 323.34 |
SMA (simple moving average) of Iris Business IRIS_BE
| SMA period | SMA current | SMA prev | SMA prev2 | | 5 day SMA | 349.51 | 343.18 | 338.02 | | 12 day SMA | 339.35 | 339.48 | 339.29 | | 20 day SMA | 349.89 | 350.57 | 351.46 | | 35 day SMA | 361.34 | 358.23 | 355.23 | | 50 day SMA | 330.44 | 328.23 | 325.84 | | 100 day SMA | 330.56 | 330.71 | 330.81 | | 150 day SMA | 369.68 | 370.19 | 370.7 | | 200 day SMA | 377.99 | 378.05 | 378.1 |
|
|
