InfibeamRe INFIBPP_E1 full analysis,charts,indicators,moving averages,SMA,DMA,EMA,ADX,MACD,RSIInfibeam Re INFIBPP_E1 WideScreen charts, DMA,SMA,EMA technical analysis, forecast prediction, by indicators ADX,MACD,RSI,CCI NSE stock exchange
Daily price and charts and targets InfibeamRe Strong Daily Stock price targets for InfibeamRe INFIBPP_E1 are 12.36 and 12.89 | Daily Target 1 | 12.25 | | Daily Target 2 | 12.46 | | Daily Target 3 | 12.783333333333 | | Daily Target 4 | 12.99 | | Daily Target 5 | 13.31 |
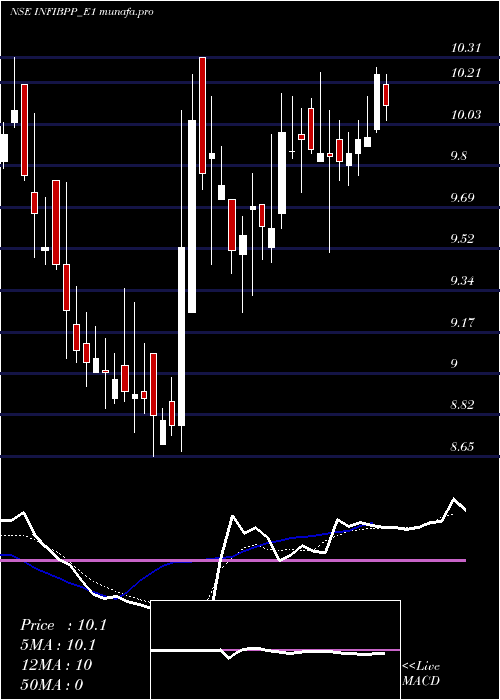
Daily price and volume Infibeam Re
| Date |
Closing |
Open |
Range |
Volume |
Tue 04 November 2025 |
12.66 (-1.48%) |
13.11 |
12.58 - 13.11 |
0.1771 times |
Mon 03 November 2025 |
12.85 (2.07%) |
12.59 |
12.59 - 13.09 |
3.857 times |
Fri 31 October 2025 |
12.59 (0.64%) |
12.51 |
12.50 - 12.70 |
0.1009 times |
Thu 30 October 2025 |
12.51 (0.32%) |
12.30 |
12.21 - 12.87 |
4.1168 times |
Wed 29 October 2025 |
12.47 (4.79%) |
12.02 |
11.90 - 12.58 |
0.7205 times |
Tue 28 October 2025 |
11.90 (0.85%) |
12.21 |
11.81 - 12.21 |
0.305 times |
Mon 27 October 2025 |
11.80 (-0.59%) |
11.90 |
11.30 - 12.21 |
0.1609 times |
Fri 24 October 2025 |
11.87 (-1.25%) |
12.13 |
11.78 - 12.13 |
0.0587 times |
Thu 23 October 2025 |
12.02 (-0.33%) |
12.12 |
11.95 - 12.33 |
0.4646 times |
Tue 21 October 2025 |
12.06 (0.5%) |
11.60 |
11.60 - 12.23 |
0.0385 times |
Mon 20 October 2025 |
12.00 (-0.08%) |
12.20 |
11.73 - 12.20 |
0.1833 times |
Weekly price and charts InfibeamRe Strong weekly Stock price targets for InfibeamRe INFIBPP_E1 are 12.62 and 13.15 | Weekly Target 1 | 12.25 | | Weekly Target 2 | 12.46 | | Weekly Target 3 | 12.783333333333 | | Weekly Target 4 | 12.99 | | Weekly Target 5 | 13.31 |
Weekly price and volumes for Infibeam Re
| Date |
Closing |
Open |
Range |
Volume |
Tue 04 November 2025 |
12.66 (0.56%) |
12.59 |
12.58 - 13.11 |
1.6334 times |
Fri 31 October 2025 |
12.59 (6.07%) |
11.90 |
11.30 - 12.87 |
2.1882 times |
Fri 24 October 2025 |
11.87 (-1.17%) |
12.20 |
11.60 - 12.33 |
0.3017 times |
Fri 17 October 2025 |
12.01 (-4.3%) |
12.50 |
11.64 - 12.74 |
0.6758 times |
Fri 10 October 2025 |
12.55 (22.68%) |
10.30 |
10.12 - 12.89 |
1.6672 times |
Fri 03 October 2025 |
10.23 (2.92%) |
9.75 |
9.75 - 10.27 |
0.354 times |
Fri 26 September 2025 |
9.94 (-2.26%) |
10.12 |
9.90 - 10.52 |
0.855 times |
Fri 19 September 2025 |
10.17 (2.62%) |
9.91 |
9.82 - 10.27 |
0.5519 times |
Fri 12 September 2025 |
9.91 (-0.6%) |
10.10 |
9.50 - 10.25 |
0.6175 times |
Fri 05 September 2025 |
9.97 (2.89%) |
9.70 |
9.46 - 10.16 |
1.1553 times |
Fri 29 August 2025 |
9.69 (-2.22%) |
9.72 |
9.25 - 9.94 |
2.1452 times |

Monthly price and charts InfibeamRe Strong monthly Stock price targets for InfibeamRe INFIBPP_E1 are 12.62 and 13.15 | Monthly Target 1 | 12.25 | | Monthly Target 2 | 12.46 | | Monthly Target 3 | 12.783333333333 | | Monthly Target 4 | 12.99 | | Monthly Target 5 | 13.31 |
Monthly price and volumes Infibeam Re
| Date |
Closing |
Open |
Range |
Volume |
Tue 04 November 2025 |
12.66 (0.56%) |
12.59 |
12.58 - 13.11 |
0.3516 times |
Fri 31 October 2025 |
12.59 (26.53%) |
9.95 |
9.95 - 12.89 |
1.0991 times |
Tue 30 September 2025 |
9.95 (2.68%) |
9.70 |
9.46 - 10.52 |
0.7019 times |
Fri 29 August 2025 |
9.69 (4.64%) |
9.20 |
8.65 - 10.31 |
1.3289 times |
Thu 31 July 2025 |
9.26 (0%) |
9.16 |
8.99 - 10.31 |
1.5186 times |
Tue 04 November 2025 |
(0%) |
|
- |
0 times |

DMA SMA EMA moving averages of Infibeam Re INFIBPP_E1
DMA (daily moving average) of Infibeam Re INFIBPP_E1
| DMA period | DMA value | | 5 day DMA | 12.62 | | 12 day DMA | 12.23 | | 20 day DMA | 12.12 | | 35 day DMA | 11.28 | | 50 day DMA | 10.84 | | 100 day DMA | | | 150 day DMA | | | 200 day DMA | | EMA (exponential moving average) of Infibeam Re INFIBPP_E1
| EMA period | EMA current | EMA prev | EMA prev2 | | 5 day EMA | 12.57 | 12.52 | 12.36 | | 12 day EMA | 12.27 | 12.2 | 12.08 | | 20 day EMA | 11.95 | 11.88 | 11.78 | | 35 day EMA | 11.48 | 11.41 | 11.32 | | 50 day EMA | 10.9 | 10.83 | 10.75 |
SMA (simple moving average) of Infibeam Re INFIBPP_E1
| SMA period | SMA current | SMA prev | SMA prev2 | | 5 day SMA | 12.62 | 12.46 | 12.25 | | 12 day SMA | 12.23 | 12.16 | 12.07 | | 20 day SMA | 12.12 | 12.02 | 11.89 | | 35 day SMA | 11.28 | 11.2 | 11.11 | | 50 day SMA | 10.84 | 10.78 | 10.72 | | 100 day SMA | | 150 day SMA | | 200 day SMA |
|
|
