IndSwift INDSWFTLAB_BE full analysis,charts,indicators,moving averages,SMA,DMA,EMA,ADX,MACD,RSIInd Swift INDSWFTLAB_BE WideScreen charts, DMA,SMA,EMA technical analysis, forecast prediction, by indicators ADX,MACD,RSI,CCI NSE stock exchange
Daily price and charts and targets IndSwift Strong Daily Stock price targets for IndSwift INDSWFTLAB_BE are 95.03 and 98.83 | Daily Target 1 | 92.15 | | Daily Target 2 | 94.11 | | Daily Target 3 | 95.953333333333 | | Daily Target 4 | 97.91 | | Daily Target 5 | 99.75 |
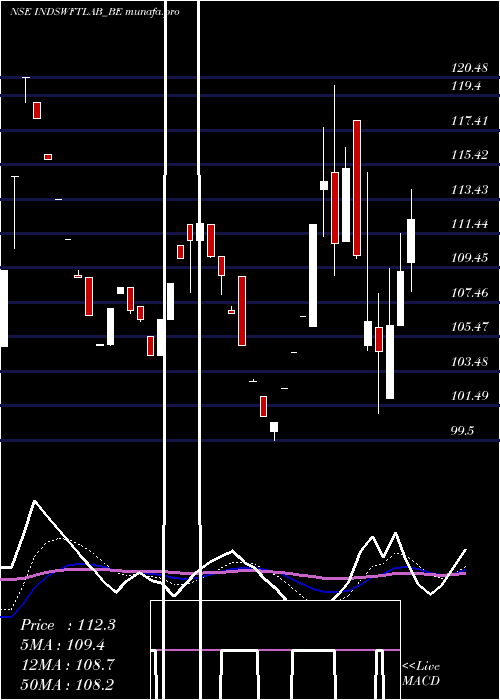
Daily price and volume Ind Swift
| Date |
Closing |
Open |
Range |
Volume |
Fri 29 August 2025 |
96.06 (2.76%) |
94.95 |
94.00 - 97.80 |
0.9645 times |
Thu 28 August 2025 |
93.48 (-2.31%) |
97.00 |
92.70 - 97.00 |
1.0798 times |
Tue 26 August 2025 |
95.69 (-1.37%) |
97.00 |
95.00 - 99.00 |
0.9741 times |
Mon 25 August 2025 |
97.02 (-0.98%) |
97.00 |
96.10 - 99.00 |
1.0218 times |
Fri 22 August 2025 |
97.98 (-1.65%) |
100.00 |
96.35 - 100.60 |
1.0632 times |
Thu 21 August 2025 |
99.62 (-0.44%) |
101.95 |
97.10 - 101.95 |
0.675 times |
Wed 20 August 2025 |
100.06 (-0.04%) |
100.10 |
99.36 - 103.40 |
0.91 times |
Tue 19 August 2025 |
100.10 (-0.39%) |
102.45 |
99.00 - 102.45 |
1.1051 times |
Mon 18 August 2025 |
100.49 (-0.94%) |
104.40 |
100.30 - 105.00 |
1.1773 times |
Thu 14 August 2025 |
101.44 (-3.93%) |
108.70 |
101.02 - 108.80 |
1.0292 times |
Wed 13 August 2025 |
105.59 (1.35%) |
106.00 |
103.06 - 107.00 |
1.0977 times |
Weekly price and charts IndSwift Strong weekly Stock price targets for IndSwift INDSWFTLAB_BE are 91.23 and 97.53 | Weekly Target 1 | 89.62 | | Weekly Target 2 | 92.84 | | Weekly Target 3 | 95.92 | | Weekly Target 4 | 99.14 | | Weekly Target 5 | 102.22 |
Weekly price and volumes for Ind Swift
| Date |
Closing |
Open |
Range |
Volume |
Fri 29 August 2025 |
96.06 (-1.96%) |
97.00 |
92.70 - 99.00 |
0.5326 times |
Fri 22 August 2025 |
97.98 (-3.41%) |
104.40 |
96.35 - 105.00 |
0.6499 times |
Thu 14 August 2025 |
101.44 (2.31%) |
102.00 |
99.70 - 108.80 |
0.6242 times |
Fri 08 August 2025 |
99.15 (-7.05%) |
106.67 |
98.01 - 110.00 |
1.4788 times |
Fri 01 August 2025 |
106.67 (1.93%) |
105.00 |
102.00 - 110.25 |
1.5532 times |
Fri 25 July 2025 |
104.65 (-2.1%) |
109.00 |
103.00 - 109.60 |
1.524 times |
Fri 18 July 2025 |
106.90 (2.16%) |
104.47 |
101.00 - 110.00 |
1.2308 times |
Fri 11 July 2025 |
104.64 (-6.78%) |
106.00 |
103.25 - 107.70 |
0.245 times |
Fri 31 January 2025 |
112.25 (1.89%) |
105.00 |
101.04 - 115.00 |
1.1679 times |
Fri 24 January 2025 |
110.17 (3.3%) |
106.05 |
106.05 - 120.00 |
0.9936 times |
Fri 17 January 2025 |
106.65 (3.64%) |
102.00 |
99.50 - 106.65 |
0.2799 times |

Monthly price and charts IndSwift Strong monthly Stock price targets for IndSwift INDSWFTLAB_BE are 85.61 and 103.16 | Monthly Target 1 | 82.12 | | Monthly Target 2 | 89.09 | | Monthly Target 3 | 99.67 | | Monthly Target 4 | 106.64 | | Monthly Target 5 | 117.22 |
Monthly price and volumes Ind Swift
| Date |
Closing |
Open |
Range |
Volume |
Fri 29 August 2025 |
96.06 (-8.51%) |
106.00 |
92.70 - 110.25 |
0.864 times |
Thu 31 July 2025 |
105.00 (-6.46%) |
106.00 |
101.00 - 110.00 |
0.8768 times |
Fri 31 January 2025 |
112.25 (3.39%) |
110.74 |
99.50 - 120.00 |
0.7508 times |
Tue 31 December 2024 |
108.57 (14.69%) |
95.25 |
86.20 - 120.48 |
1.2442 times |
Fri 29 November 2024 |
94.66 (-19.48%) |
119.91 |
90.95 - 119.91 |
0.6187 times |
Thu 31 October 2024 |
117.56 (-9.02%) |
131.40 |
109.70 - 134.40 |
1.0517 times |
Mon 30 September 2024 |
129.22 (-13.1%) |
149.99 |
127.26 - 158.56 |
1.455 times |
Fri 30 August 2024 |
148.70 (504.47%) |
136.98 |
123.62 - 150.00 |
2.5777 times |
Tue 26 May 2020 |
24.60 (14.95%) |
21.00 |
19.25 - 27.35 |
0.2518 times |
Thu 30 April 2020 |
21.40 (5.16%) |
20.10 |
20.10 - 26.95 |
0.3094 times |
Tue 31 March 2020 |
20.35 (-19.57%) |
21.00 |
19.00 - 22.05 |
0.0715 times |

DMA SMA EMA moving averages of Ind Swift INDSWFTLAB_BE
DMA (daily moving average) of Ind Swift INDSWFTLAB_BE
| DMA period | DMA value | | 5 day DMA | 96.05 | | 12 day DMA | 99.31 | | 20 day DMA | 100.62 | | 35 day DMA | 103.05 | | 50 day DMA | 104.27 | | 100 day DMA | 105.99 | | 150 day DMA | 114.95 | | 200 day DMA | 92.07 | EMA (exponential moving average) of Ind Swift INDSWFTLAB_BE
| EMA period | EMA current | EMA prev | EMA prev2 | | 5 day EMA | 96.24 | 96.33 | 97.76 | | 12 day EMA | 98.37 | 98.79 | 99.75 | | 20 day EMA | 100 | 100.42 | 101.15 | | 35 day EMA | 102.02 | 102.37 | 102.89 | | 50 day EMA | 103.8 | 104.12 | 104.55 |
SMA (simple moving average) of Ind Swift INDSWFTLAB_BE
| SMA period | SMA current | SMA prev | SMA prev2 | | 5 day SMA | 96.05 | 96.76 | 98.07 | | 12 day SMA | 99.31 | 99.95 | 100.42 | | 20 day SMA | 100.62 | 101.08 | 101.69 | | 35 day SMA | 103.05 | 103.42 | 103.79 | | 50 day SMA | 104.27 | 104.45 | 104.72 | | 100 day SMA | 105.99 | 106.16 | 106.38 | | 150 day SMA | 114.95 | 114.47 | 114.01 | | 200 day SMA | 92.07 | 91.73 | 91.39 |
|
|
