IndoRama INDORAMA_BE full analysis,charts,indicators,moving averages,SMA,DMA,EMA,ADX,MACD,RSIIndo Rama INDORAMA_BE WideScreen charts, DMA,SMA,EMA technical analysis, forecast prediction, by indicators ADX,MACD,RSI,CCI NSE stock exchange
Daily price and charts and targets IndoRama Strong Daily Stock price targets for IndoRama INDORAMA_BE are 48.8 and 50.75 | Daily Target 1 | 48.23 | | Daily Target 2 | 49.36 | | Daily Target 3 | 50.18 | | Daily Target 4 | 51.31 | | Daily Target 5 | 52.13 |
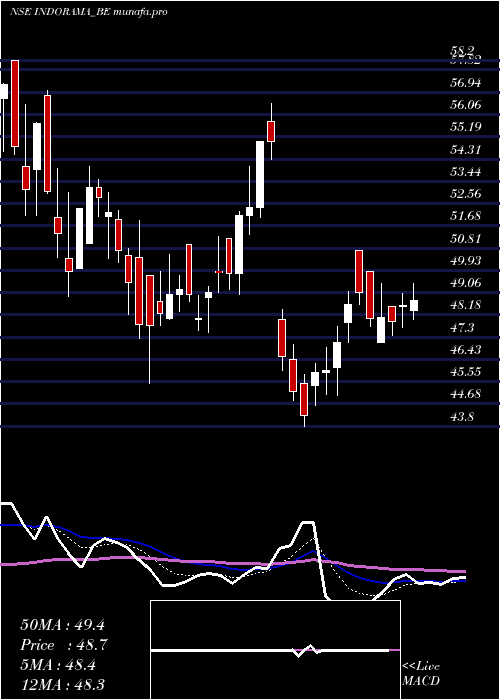
Daily price and volume Indo Rama
| Date |
Closing |
Open |
Range |
Volume |
Fri 29 August 2025 |
50.49 (0.74%) |
50.99 |
49.05 - 51.00 |
0.3341 times |
Thu 28 August 2025 |
50.12 (-0.65%) |
49.00 |
48.20 - 51.80 |
1.2941 times |
Tue 26 August 2025 |
50.45 (-4.83%) |
52.25 |
50.35 - 53.50 |
0.6502 times |
Mon 25 August 2025 |
53.01 (-1.69%) |
55.25 |
52.30 - 55.40 |
0.3827 times |
Fri 22 August 2025 |
53.92 (0.75%) |
53.52 |
52.00 - 55.40 |
0.4482 times |
Thu 21 August 2025 |
53.52 (-3.57%) |
55.40 |
52.72 - 55.40 |
0.9151 times |
Wed 20 August 2025 |
55.50 (-2.13%) |
56.30 |
54.36 - 57.85 |
1.4752 times |
Tue 19 August 2025 |
56.71 (5%) |
56.71 |
55.00 - 56.71 |
3.529 times |
Mon 18 August 2025 |
54.01 (5%) |
54.01 |
54.01 - 54.01 |
0.4926 times |
Thu 14 August 2025 |
51.44 (-1.85%) |
53.25 |
51.00 - 53.41 |
0.4789 times |
Wed 13 August 2025 |
52.41 (2.99%) |
51.50 |
50.55 - 52.99 |
0.8896 times |
Weekly price and charts IndoRama Strong weekly Stock price targets for IndoRama INDORAMA_BE are 45.75 and 52.95 | Weekly Target 1 | 44.16 | | Weekly Target 2 | 47.33 | | Weekly Target 3 | 51.363333333333 | | Weekly Target 4 | 54.53 | | Weekly Target 5 | 58.56 |
Weekly price and volumes for Indo Rama
| Date |
Closing |
Open |
Range |
Volume |
Fri 29 August 2025 |
50.49 (-6.36%) |
55.25 |
48.20 - 55.40 |
0.8227 times |
Fri 22 August 2025 |
53.92 (4.82%) |
54.01 |
52.00 - 57.85 |
2.1209 times |
Thu 14 August 2025 |
51.44 (3.5%) |
48.30 |
48.30 - 53.41 |
0.6706 times |
Fri 08 August 2025 |
49.70 (-1.33%) |
50.37 |
49.00 - 52.20 |
0.3856 times |
Fri 01 August 2025 |
50.37 (-1.66%) |
50.50 |
49.10 - 53.55 |
0.7154 times |
Fri 25 July 2025 |
51.22 (0.87%) |
51.90 |
50.15 - 53.99 |
1.2368 times |
Fri 18 July 2025 |
50.78 (-0.98%) |
51.25 |
48.85 - 52.70 |
0.8347 times |
Fri 11 July 2025 |
51.28 (6.77%) |
48.50 |
47.40 - 52.50 |
1.5038 times |
Fri 04 July 2025 |
48.03 (-0.02%) |
47.11 |
47.11 - 49.42 |
0.9731 times |
Fri 27 June 2025 |
48.04 (4.62%) |
45.90 |
45.00 - 50.70 |
0.7364 times |
Fri 20 June 2025 |
45.92 (-16.51%) |
48.01 |
43.80 - 48.40 |
0.5126 times |

Monthly price and charts IndoRama Strong monthly Stock price targets for IndoRama INDORAMA_BE are 44.52 and 54.17 | Monthly Target 1 | 42.53 | | Monthly Target 2 | 46.51 | | Monthly Target 3 | 52.18 | | Monthly Target 4 | 56.16 | | Monthly Target 5 | 61.83 |
Monthly price and volumes Indo Rama
| Date |
Closing |
Open |
Range |
Volume |
Fri 29 August 2025 |
50.49 (-3.55%) |
52.85 |
48.20 - 57.85 |
1.8646 times |
Thu 31 July 2025 |
52.35 (8.86%) |
48.49 |
47.37 - 53.99 |
2.3053 times |
Mon 30 June 2025 |
48.09 (-12.56%) |
48.01 |
43.80 - 50.70 |
0.6257 times |
Thu 09 September 2021 |
55.00 (14.46%) |
48.85 |
47.50 - 56.50 |
0.4375 times |
Tue 31 August 2021 |
48.05 (-7.86%) |
53.10 |
45.50 - 58.20 |
0.8767 times |
Fri 30 July 2021 |
52.15 (6.32%) |
49.70 |
48.15 - 62.35 |
2.0779 times |
Wed 30 June 2021 |
49.05 (37.78%) |
55.00 |
47.95 - 57.00 |
0.6509 times |
Mon 01 April 2019 |
35.60 (1.71%) |
35.80 |
35.10 - 36.75 |
0.0196 times |
Fri 29 March 2019 |
35.00 (1.3%) |
34.55 |
34.05 - 36.85 |
0.6206 times |
Thu 28 February 2019 |
34.55 (0.73%) |
34.50 |
33.75 - 35.50 |
0.5212 times |
Thu 31 January 2019 |
34.30 (0%) |
30.10 |
28.45 - 40.60 |
1.2858 times |

DMA SMA EMA moving averages of Indo Rama INDORAMA_BE
DMA (daily moving average) of Indo Rama INDORAMA_BE
| DMA period | DMA value | | 5 day DMA | 51.6 | | 12 day DMA | 52.71 | | 20 day DMA | 51.86 | | 35 day DMA | 51.62 | | 50 day DMA | 50.58 | | 100 day DMA | 51.74 | | 150 day DMA | 47.96 | | 200 day DMA | | EMA (exponential moving average) of Indo Rama INDORAMA_BE
| EMA period | EMA current | EMA prev | EMA prev2 | | 5 day EMA | 51.34 | 51.77 | 52.59 | | 12 day EMA | 51.98 | 52.25 | 52.64 | | 20 day EMA | 51.9 | 52.05 | 52.25 | | 35 day EMA | 51.34 | 51.39 | 51.46 | | 50 day EMA | 50.69 | 50.7 | 50.72 |
SMA (simple moving average) of Indo Rama INDORAMA_BE
| SMA period | SMA current | SMA prev | SMA prev2 | | 5 day SMA | 51.6 | 52.2 | 53.28 | | 12 day SMA | 52.71 | 52.66 | 52.63 | | 20 day SMA | 51.86 | 51.96 | 52.03 | | 35 day SMA | 51.62 | 51.66 | 51.68 | | 50 day SMA | 50.58 | 50.48 | 50.41 | | 100 day SMA | 51.74 | 51.73 | 51.72 | | 150 day SMA | 47.96 | 47.85 | 47.75 | | 200 day SMA |
|
|
