IndustrialInv IITL_BE full analysis,charts,indicators,moving averages,SMA,DMA,EMA,ADX,MACD,RSIIndustrial Inv IITL_BE WideScreen charts, DMA,SMA,EMA technical analysis, forecast prediction, by indicators ADX,MACD,RSI,CCI NSE stock exchange
Daily price and charts and targets IndustrialInv Strong Daily Stock price targets for IndustrialInv IITL_BE are 171.4 and 175.25 | Daily Target 1 | 168.38 | | Daily Target 2 | 170.57 | | Daily Target 3 | 172.23333333333 | | Daily Target 4 | 174.42 | | Daily Target 5 | 176.08 |
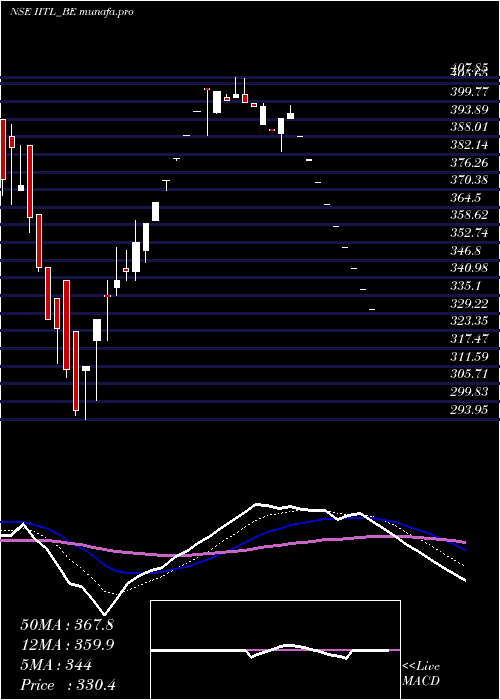
Daily price and volume Industrial Inv
| Date |
Closing |
Open |
Range |
Volume |
Mon 01 September 2025 |
172.75 (1.62%) |
170.05 |
170.05 - 173.90 |
0.7292 times |
Fri 29 August 2025 |
170.00 (-0.64%) |
171.06 |
168.00 - 171.06 |
0.1165 times |
Thu 28 August 2025 |
171.09 (0.05%) |
171.00 |
168.05 - 172.99 |
0.6683 times |
Tue 26 August 2025 |
171.00 (-1.66%) |
181.90 |
168.05 - 181.90 |
1.6201 times |
Mon 25 August 2025 |
173.88 (1.68%) |
171.00 |
168.60 - 173.88 |
0.6048 times |
Fri 22 August 2025 |
171.00 (-1.71%) |
169.00 |
168.02 - 173.98 |
2.7708 times |
Thu 21 August 2025 |
173.98 (0.76%) |
172.66 |
169.05 - 174.00 |
0.4549 times |
Wed 20 August 2025 |
172.66 (-0.02%) |
171.83 |
169.10 - 172.69 |
1.103 times |
Tue 19 August 2025 |
172.69 (1.52%) |
169.02 |
169.02 - 172.88 |
0.7056 times |
Mon 18 August 2025 |
170.10 (-0.18%) |
171.48 |
169.30 - 175.99 |
1.2267 times |
Thu 14 August 2025 |
170.40 (-0.06%) |
170.51 |
169.20 - 171.50 |
1.1409 times |
Weekly price and charts IndustrialInv Strong weekly Stock price targets for IndustrialInv IITL_BE are 171.4 and 175.25 | Weekly Target 1 | 168.38 | | Weekly Target 2 | 170.57 | | Weekly Target 3 | 172.23333333333 | | Weekly Target 4 | 174.42 | | Weekly Target 5 | 176.08 |
Weekly price and volumes for Industrial Inv
| Date |
Closing |
Open |
Range |
Volume |
Mon 01 September 2025 |
172.75 (1.62%) |
170.05 |
170.05 - 173.90 |
0.038 times |
Fri 29 August 2025 |
170.00 (-0.58%) |
171.00 |
168.00 - 181.90 |
0.157 times |
Fri 22 August 2025 |
171.00 (0.35%) |
171.48 |
168.02 - 175.99 |
0.3266 times |
Thu 14 August 2025 |
170.40 (0.86%) |
168.11 |
160.40 - 171.99 |
1.2158 times |
Fri 08 August 2025 |
168.95 (6.59%) |
160.00 |
153.00 - 169.74 |
0.5911 times |
Fri 01 August 2025 |
158.50 (-4.58%) |
166.00 |
155.00 - 167.90 |
0.2656 times |
Fri 25 July 2025 |
166.10 (-2.81%) |
167.70 |
163.35 - 173.00 |
0.377 times |
Fri 18 July 2025 |
170.91 (2.28%) |
171.00 |
166.60 - 172.95 |
0.6708 times |
Fri 11 July 2025 |
167.10 (-0.74%) |
168.35 |
162.55 - 170.02 |
0.3371 times |
Fri 04 July 2025 |
168.35 (-0.71%) |
170.40 |
167.00 - 171.00 |
6.021 times |
Fri 27 June 2025 |
169.56 (-0.47%) |
171.21 |
168.55 - 175.00 |
7.8048 times |

Monthly price and charts IndustrialInv Strong monthly Stock price targets for IndustrialInv IITL_BE are 171.4 and 175.25 | Monthly Target 1 | 168.38 | | Monthly Target 2 | 170.57 | | Monthly Target 3 | 172.23333333333 | | Monthly Target 4 | 174.42 | | Monthly Target 5 | 176.08 |
Monthly price and volumes Industrial Inv
| Date |
Closing |
Open |
Range |
Volume |
Mon 01 September 2025 |
172.75 (1.62%) |
170.05 |
170.05 - 173.90 |
0.0037 times |
Fri 29 August 2025 |
170.00 (7.67%) |
157.00 |
153.00 - 181.90 |
0.2216 times |
Thu 31 July 2025 |
157.89 (-6.79%) |
170.01 |
155.00 - 173.00 |
0.3372 times |
Mon 30 June 2025 |
169.40 (-40.44%) |
173.00 |
168.00 - 184.00 |
4.7752 times |
Fri 07 March 2025 |
284.40 (-0.37%) |
285.45 |
245.35 - 299.70 |
0.0816 times |
Fri 28 February 2025 |
285.45 (-28.55%) |
399.00 |
280.35 - 399.00 |
0.2666 times |
Fri 31 January 2025 |
399.50 (7.51%) |
385.00 |
293.95 - 407.85 |
1.7881 times |
Tue 31 December 2024 |
371.60 (-8.65%) |
427.10 |
365.50 - 444.95 |
0.8161 times |
Fri 29 November 2024 |
406.80 (24.4%) |
331.00 |
331.00 - 425.75 |
1.3403 times |
Thu 31 October 2024 |
327.00 (7.39%) |
310.50 |
289.10 - 330.80 |
0.3695 times |
Mon 30 September 2024 |
304.50 (16.93%) |
269.00 |
251.50 - 304.50 |
2.0722 times |

DMA SMA EMA moving averages of Industrial Inv IITL_BE
DMA (daily moving average) of Industrial Inv IITL_BE
| DMA period | DMA value | | 5 day DMA | 171.74 | | 12 day DMA | 171.67 | | 20 day DMA | 168.67 | | 35 day DMA | 167.95 | | 50 day DMA | 168.44 | | 100 day DMA | 243.5 | | 150 day DMA | 288.23 | | 200 day DMA | 284.63 | EMA (exponential moving average) of Industrial Inv IITL_BE
| EMA period | EMA current | EMA prev | EMA prev2 | | 5 day EMA | 171.66 | 171.11 | 171.66 | | 12 day EMA | 170.86 | 170.52 | 170.62 | | 20 day EMA | 169.93 | 169.63 | 169.59 | | 35 day EMA | 169.6 | 169.41 | 169.38 | | 50 day EMA | 169.26 | 169.12 | 169.08 |
SMA (simple moving average) of Industrial Inv IITL_BE
| SMA period | SMA current | SMA prev | SMA prev2 | | 5 day SMA | 171.74 | 171.39 | 172.19 | | 12 day SMA | 171.67 | 171.14 | 171.04 | | 20 day SMA | 168.67 | 167.93 | 167.53 | | 35 day SMA | 167.95 | 167.79 | 167.76 | | 50 day SMA | 168.44 | 168.44 | 168.54 | | 100 day SMA | 243.5 | 244.74 | 246.15 | | 150 day SMA | 288.23 | 289.21 | 290.16 | | 200 day SMA | 284.63 | 284.91 | 285.23 |
|
|
