IndiabullsEnt IEL_BE full analysis,charts,indicators,moving averages,SMA,DMA,EMA,ADX,MACD,RSIIndiabulls Ent IEL_BE WideScreen charts, DMA,SMA,EMA technical analysis, forecast prediction, by indicators ADX,MACD,RSI,CCI NSE stock exchange
Daily price and charts and targets IndiabullsEnt Strong Daily Stock price targets for IndiabullsEnt IEL_BE are 18.12 and 18.73 | Daily Target 1 | 17.61 | | Daily Target 2 | 18.01 | | Daily Target 3 | 18.216666666667 | | Daily Target 4 | 18.62 | | Daily Target 5 | 18.83 |
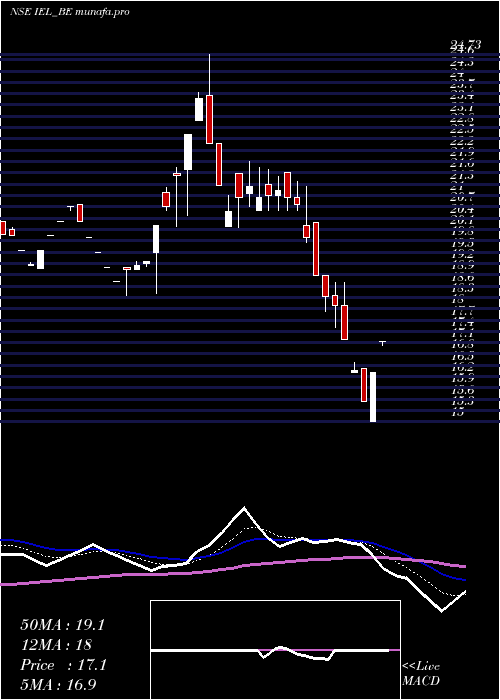
Daily price and volume Indiabulls Ent
| Date |
Closing |
Open |
Range |
Volume |
Fri 29 August 2025 |
18.42 (4.96%) |
17.98 |
17.81 - 18.42 |
1.9151 times |
Thu 28 August 2025 |
17.55 (0.52%) |
17.30 |
17.01 - 17.95 |
0.3774 times |
Tue 26 August 2025 |
17.46 (-4.49%) |
17.65 |
17.37 - 17.98 |
1.2225 times |
Mon 25 August 2025 |
18.28 (-5.04%) |
19.70 |
18.28 - 19.78 |
1.7764 times |
Fri 22 August 2025 |
19.25 (4.9%) |
18.80 |
18.20 - 19.26 |
1.707 times |
Thu 21 August 2025 |
18.35 (4.2%) |
17.90 |
17.73 - 18.49 |
0.69 times |
Wed 20 August 2025 |
17.61 (3.16%) |
17.38 |
17.02 - 17.89 |
0.4328 times |
Tue 19 August 2025 |
17.07 (-1.61%) |
17.75 |
17.00 - 17.75 |
1.1658 times |
Mon 18 August 2025 |
17.35 (-1.48%) |
17.61 |
17.22 - 18.00 |
0.2404 times |
Thu 14 August 2025 |
17.61 (-1.68%) |
17.84 |
17.25 - 18.23 |
0.4725 times |
Wed 13 August 2025 |
17.91 (-1.05%) |
17.74 |
17.74 - 18.48 |
0.1825 times |
Weekly price and charts IndiabullsEnt Strong weekly Stock price targets for IndiabullsEnt IEL_BE are 16.33 and 19.1 | Weekly Target 1 | 15.63 | | Weekly Target 2 | 17.03 | | Weekly Target 3 | 18.403333333333 | | Weekly Target 4 | 19.8 | | Weekly Target 5 | 21.17 |
Weekly price and volumes for Indiabulls Ent
| Date |
Closing |
Open |
Range |
Volume |
Fri 29 August 2025 |
18.42 (-4.31%) |
19.70 |
17.01 - 19.78 |
0.7473 times |
Fri 22 August 2025 |
19.25 (9.31%) |
17.61 |
17.00 - 19.26 |
0.5982 times |
Thu 14 August 2025 |
17.61 (0.06%) |
17.60 |
17.25 - 18.76 |
0.2134 times |
Fri 08 August 2025 |
17.60 (3.71%) |
17.05 |
15.99 - 18.00 |
1.3103 times |
Fri 01 August 2025 |
16.97 (-2.92%) |
17.48 |
16.50 - 18.25 |
0.3926 times |
Fri 25 July 2025 |
17.48 (-5.15%) |
18.74 |
17.06 - 18.74 |
0.6718 times |
Fri 18 July 2025 |
18.43 (-2.9%) |
19.07 |
18.10 - 19.65 |
1.147 times |
Fri 11 July 2025 |
18.98 (-4.19%) |
19.81 |
18.30 - 20.79 |
1.562 times |
Fri 04 July 2025 |
19.81 (-9.83%) |
22.49 |
19.69 - 23.62 |
1.1156 times |
Fri 27 June 2025 |
21.97 (21.11%) |
24.11 |
21.66 - 26.64 |
2.2418 times |
Fri 11 April 2025 |
18.14 (0.11%) |
17.21 |
16.34 - 18.30 |
0.1653 times |

Monthly price and charts IndiabullsEnt Strong monthly Stock price targets for IndiabullsEnt IEL_BE are 17.21 and 21 | Monthly Target 1 | 14.27 | | Monthly Target 2 | 16.35 | | Monthly Target 3 | 18.063333333333 | | Monthly Target 4 | 20.14 | | Monthly Target 5 | 21.85 |
Monthly price and volumes Indiabulls Ent
| Date |
Closing |
Open |
Range |
Volume |
Fri 29 August 2025 |
18.42 (8.61%) |
16.96 |
15.99 - 19.78 |
1.3068 times |
Thu 31 July 2025 |
16.96 (-24.62%) |
23.62 |
16.50 - 23.62 |
2.1358 times |
Mon 30 June 2025 |
22.50 (24.04%) |
24.11 |
21.04 - 26.64 |
1.0606 times |
Fri 11 April 2025 |
18.14 (20.45%) |
15.06 |
15.05 - 18.30 |
0.1891 times |
Fri 28 March 2025 |
15.06 (-20.53%) |
18.57 |
15.06 - 18.57 |
0.4009 times |
Fri 28 February 2025 |
18.95 (-10.74%) |
20.60 |
15.00 - 21.75 |
0.6462 times |
Fri 31 January 2025 |
21.23 (8.59%) |
19.15 |
18.35 - 24.73 |
1.7387 times |
Tue 31 December 2024 |
19.55 (-6.59%) |
20.50 |
19.10 - 24.51 |
1.3077 times |
Fri 29 November 2024 |
20.93 (78.13%) |
20.00 |
18.53 - 21.49 |
0.8661 times |
Mon 07 October 2024 |
11.75 (-7.92%) |
12.95 |
11.67 - 13.25 |
0.3481 times |
Mon 30 September 2024 |
12.76 (-9.82%) |
13.80 |
11.42 - 14.15 |
1.6366 times |

DMA SMA EMA moving averages of Indiabulls Ent IEL_BE
DMA (daily moving average) of Indiabulls Ent IEL_BE
| DMA period | DMA value | | 5 day DMA | 18.19 | | 12 day DMA | 17.91 | | 20 day DMA | 17.62 | | 35 day DMA | 17.83 | | 50 day DMA | 18.88 | | 100 day DMA | 18.58 | | 150 day DMA | 18.7 | | 200 day DMA | 17.11 | EMA (exponential moving average) of Indiabulls Ent IEL_BE
| EMA period | EMA current | EMA prev | EMA prev2 | | 5 day EMA | 18.04 | 17.85 | 18 | | 12 day EMA | 17.92 | 17.83 | 17.88 | | 20 day EMA | 17.9 | 17.85 | 17.88 | | 35 day EMA | 18.27 | 18.26 | 18.3 | | 50 day EMA | 18.68 | 18.69 | 18.74 |
SMA (simple moving average) of Indiabulls Ent IEL_BE
| SMA period | SMA current | SMA prev | SMA prev2 | | 5 day SMA | 18.19 | 18.18 | 18.19 | | 12 day SMA | 17.91 | 17.91 | 17.92 | | 20 day SMA | 17.62 | 17.57 | 17.56 | | 35 day SMA | 17.83 | 17.84 | 17.9 | | 50 day SMA | 18.88 | 18.85 | 18.85 | | 100 day SMA | 18.58 | 18.61 | 18.64 | | 150 day SMA | 18.7 | 18.66 | 18.63 | | 200 day SMA | 17.11 | 17.08 | 17.05 |
|
|
