IdealTechnoplast IDEALTECHO_ST full analysis,charts,indicators,moving averages,SMA,DMA,EMA,ADX,MACD,RSIIdeal Technoplast IDEALTECHO_ST WideScreen charts, DMA,SMA,EMA technical analysis, forecast prediction, by indicators ADX,MACD,RSI,CCI NSE stock exchange
Daily price and charts and targets IdealTechnoplast Strong Daily Stock price targets for IdealTechnoplast IDEALTECHO_ST are 200 and 200 | Daily Target 1 | 200 | | Daily Target 2 | 200 | | Daily Target 3 | 200 | | Daily Target 4 | 200 | | Daily Target 5 | 200 |
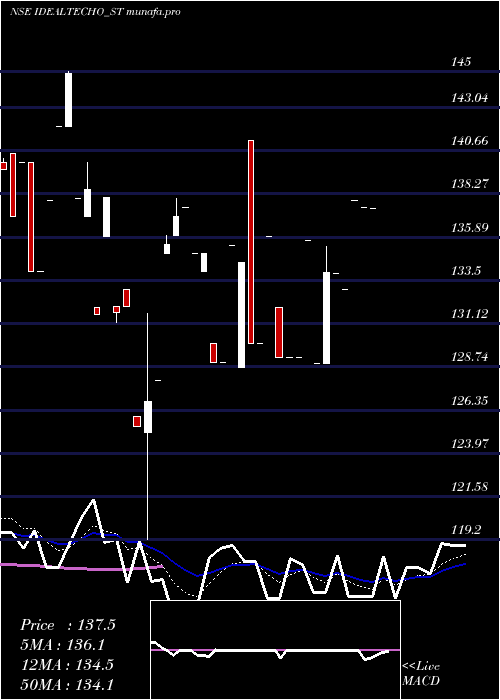
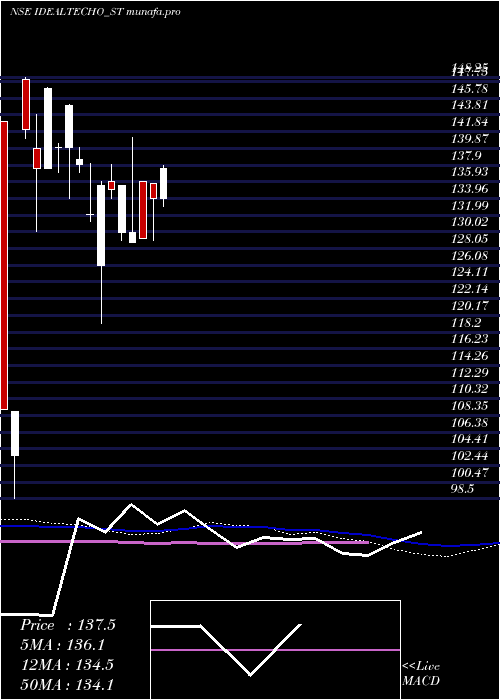
Daily price and volume Ideal Technoplast
| Date |
Closing |
Open |
Range |
Volume |
Tue 04 November 2025 |
200.00 (0%) |
200.00 |
200.00 - 200.00 |
0.6977 times |
Mon 03 November 2025 |
200.00 (-0.97%) |
201.95 |
200.00 - 201.95 |
0.6977 times |
Fri 31 October 2025 |
201.95 (2.54%) |
199.00 |
199.00 - 201.95 |
2.093 times |
Thu 30 October 2025 |
196.95 (0.48%) |
198.00 |
196.95 - 198.00 |
1.3953 times |
Wed 29 October 2025 |
196.00 (0.51%) |
200.00 |
196.00 - 202.15 |
1.8605 times |
Tue 28 October 2025 |
195.00 (-4.88%) |
201.00 |
195.00 - 201.00 |
1.3953 times |
Thu 23 October 2025 |
205.00 (0%) |
205.00 |
205.00 - 205.00 |
0.4651 times |
Mon 20 October 2025 |
205.00 (-1.44%) |
205.00 |
205.00 - 205.00 |
0.4651 times |
Fri 17 October 2025 |
208.00 (3.17%) |
208.00 |
208.00 - 208.00 |
0.4651 times |
Thu 16 October 2025 |
201.60 (5%) |
201.60 |
201.60 - 201.60 |
0.4651 times |
Tue 14 October 2025 |
192.00 (0.29%) |
193.00 |
192.00 - 193.00 |
0.9302 times |
Weekly price and charts IdealTechnoplast Strong weekly Stock price targets for IdealTechnoplast IDEALTECHO_ST are 199.03 and 200.98 | Weekly Target 1 | 198.7 | | Weekly Target 2 | 199.35 | | Weekly Target 3 | 200.65 | | Weekly Target 4 | 201.3 | | Weekly Target 5 | 202.6 |
Weekly price and volumes for Ideal Technoplast
| Date |
Closing |
Open |
Range |
Volume |
Tue 04 November 2025 |
200.00 (-0.97%) |
201.95 |
200.00 - 201.95 |
0.4444 times |
Fri 31 October 2025 |
201.95 (-1.49%) |
201.00 |
195.00 - 202.15 |
2.1481 times |
Thu 23 October 2025 |
205.00 (-1.44%) |
205.00 |
205.00 - 205.00 |
0.2963 times |
Fri 17 October 2025 |
208.00 (8.64%) |
193.00 |
192.00 - 208.00 |
0.5926 times |
Thu 09 October 2025 |
191.45 (-5.22%) |
212.10 |
191.45 - 212.10 |
0.7407 times |
Fri 03 October 2025 |
202.00 (5.26%) |
200.00 |
200.00 - 202.00 |
0.4444 times |
Fri 26 September 2025 |
191.90 (-2.59%) |
189.10 |
189.10 - 205.00 |
0.5926 times |
Fri 19 September 2025 |
197.00 (-5.54%) |
208.55 |
197.00 - 208.55 |
0.8889 times |
Fri 12 September 2025 |
208.55 (-2.55%) |
220.00 |
208.55 - 221.00 |
1.4815 times |
Fri 05 September 2025 |
214.00 (55.69%) |
215.25 |
205.50 - 220.00 |
2.3704 times |
Fri 09 May 2025 |
137.45 (2.61%) |
133.90 |
133.00 - 137.90 |
0.7407 times |
Monthly price and charts IdealTechnoplast Strong monthly Stock price targets for IdealTechnoplast IDEALTECHO_ST are 199.03 and 200.98 | Monthly Target 1 | 198.7 | | Monthly Target 2 | 199.35 | | Monthly Target 3 | 200.65 | | Monthly Target 4 | 201.3 | | Monthly Target 5 | 202.6 |
Monthly price and volumes Ideal Technoplast
| Date |
Closing |
Open |
Range |
Volume |
Tue 04 November 2025 |
200.00 (-0.97%) |
201.95 |
200.00 - 201.95 |
0.0105 times |
Fri 31 October 2025 |
201.95 (0.47%) |
202.00 |
191.45 - 212.10 |
0.0929 times |
Tue 30 September 2025 |
201.00 (46.23%) |
215.25 |
189.10 - 221.00 |
0.1332 times |
Fri 09 May 2025 |
137.45 (6.59%) |
128.95 |
128.95 - 137.90 |
0.0385 times |
Wed 30 April 2025 |
128.95 (-4.83%) |
136.00 |
128.70 - 141.20 |
0.1332 times |
Fri 28 March 2025 |
135.50 (-3.21%) |
140.00 |
119.20 - 145.00 |
0.2488 times |
Thu 27 February 2025 |
140.00 (28.68%) |
148.00 |
130.05 - 148.25 |
0.2383 times |
Tue 10 September 2024 |
108.80 (-22.78%) |
143.00 |
98.50 - 143.00 |
2.9153 times |
Fri 30 August 2024 |
140.90 (0%) |
132.10 |
132.10 - 145.60 |
5.1894 times |
Wed 05 November 2025 |
(0%) |
|
- |
0 times |

DMA SMA EMA moving averages of Ideal Technoplast IDEALTECHO_ST
DMA (daily moving average) of Ideal Technoplast IDEALTECHO_ST
| DMA period | DMA value | | 5 day DMA | 198.98 | | 12 day DMA | 199.41 | | 20 day DMA | 200.02 | | 35 day DMA | 196.23 | | 50 day DMA | 176.94 | | 100 day DMA | | | 150 day DMA | | | 200 day DMA | | EMA (exponential moving average) of Ideal Technoplast IDEALTECHO_ST
| EMA period | EMA current | EMA prev | EMA prev2 | | 5 day EMA | 199.81 | 199.72 | 199.58 | | 12 day EMA | 199.83 | 199.8 | 199.76 | | 20 day EMA | 197.9 | 197.68 | 197.44 | | 35 day EMA | 186.56 | 185.77 | 184.93 | | 50 day EMA | 175.67 | 174.68 | 173.65 |
SMA (simple moving average) of Ideal Technoplast IDEALTECHO_ST
| SMA period | SMA current | SMA prev | SMA prev2 | | 5 day SMA | 198.98 | 197.98 | 198.98 | | 12 day SMA | 199.41 | 199.54 | 200.55 | | 20 day SMA | 200.02 | 199.93 | 199.84 | | 35 day SMA | 196.23 | 194.34 | 192.45 | | 50 day SMA | 176.94 | 175.64 | 174.39 | | 100 day SMA | | 150 day SMA | | 200 day SMA |
|
|
