HeranbaIndustries HERANBA_BE full analysis,charts,indicators,moving averages,SMA,DMA,EMA,ADX,MACD,RSIHeranba Industries HERANBA_BE WideScreen charts, DMA,SMA,EMA technical analysis, forecast prediction, by indicators ADX,MACD,RSI,CCI NSE stock exchange
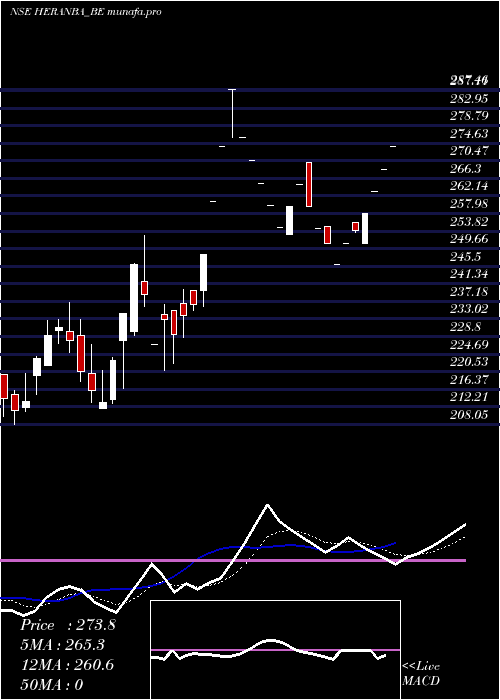
Daily price and charts and targets HeranbaIndustries Strong Daily Stock price targets for HeranbaIndustries HERANBA_BE are 273.75 and 273.75 | Daily Target 1 | 273.75 | | Daily Target 2 | 273.75 | | Daily Target 3 | 273.75 | | Daily Target 4 | 273.75 | | Daily Target 5 | 273.75 |
Daily price and volume Heranba Industries
| Date |
Closing |
Open |
Range |
Volume |
| Mon 19 May 2025 |
273.75 (1.99%) |
273.75 |
273.75 - 273.75 |
0.8775 times |
| Fri 16 May 2025 |
268.40 (2%) |
268.40 |
268.40 - 268.40 |
0.3276 times |
| Thu 15 May 2025 |
263.15 (2%) |
263.15 |
263.15 - 263.15 |
1.8665 times |
| Wed 14 May 2025 |
258.00 (1.57%) |
251.00 |
251.00 - 258.00 |
1.1534 times |
| Tue 13 May 2025 |
254.00 (1.24%) |
255.90 |
253.50 - 255.90 |
1.5306 times |
| Mon 12 May 2025 |
250.90 (1.99%) |
250.90 |
250.90 - 250.90 |
1.017 times |
| Fri 09 May 2025 |
246.00 (-1.99%) |
246.00 |
246.00 - 246.00 |
0.1187 times |
| Thu 08 May 2025 |
251.00 (-1.32%) |
255.00 |
251.00 - 255.00 |
0.4313 times |
| Wed 07 May 2025 |
254.35 (-2%) |
254.35 |
254.35 - 254.35 |
0.7919 times |
| Tue 06 May 2025 |
259.55 (-2%) |
270.10 |
259.55 - 270.10 |
1.8855 times |
| Mon 05 May 2025 |
264.85 (1.98%) |
264.85 |
264.85 - 264.85 |
2.2921 times |
Weekly price and charts HeranbaIndustries Strong weekly Stock price targets for HeranbaIndustries HERANBA_BE are 273.75 and 273.75 | Weekly Target 1 | 273.75 | | Weekly Target 2 | 273.75 | | Weekly Target 3 | 273.75 | | Weekly Target 4 | 273.75 | | Weekly Target 5 | 273.75 |
Weekly price and volumes for Heranba Industries
| Date |
Closing |
Open |
Range |
Volume |
| Mon 19 May 2025 |
273.75 (1.99%) |
273.75 |
273.75 - 273.75 |
0.0644 times |
| Fri 16 May 2025 |
268.40 (9.11%) |
250.90 |
250.90 - 268.40 |
0.4325 times |
| Fri 09 May 2025 |
246.00 (-5.28%) |
264.85 |
246.00 - 270.10 |
0.4049 times |
| Fri 02 May 2025 |
259.70 (-4.01%) |
265.12 |
253.00 - 265.12 |
0.4418 times |
| Fri 25 April 2025 |
270.54 (3.75%) |
273.78 |
270.54 - 287.46 |
0.8486 times |
| Thu 17 April 2025 |
260.75 (11.56%) |
239.84 |
235.00 - 260.75 |
0.4473 times |
| Fri 11 April 2025 |
233.74 (-2.14%) |
226.90 |
220.89 - 240.00 |
0.5927 times |
| Fri 04 April 2025 |
238.85 (12%) |
214.00 |
213.00 - 252.80 |
1.2585 times |
| Fri 28 March 2025 |
213.26 (-7.64%) |
230.15 |
211.77 - 237.00 |
2.7543 times |
| Fri 21 March 2025 |
230.91 (7.82%) |
215.05 |
208.05 - 233.00 |
2.755 times |
| Thu 13 March 2025 |
214.16 (0%) |
237.27 |
208.00 - 238.45 |
2.2993 times |
Monthly price and charts HeranbaIndustries Strong monthly Stock price targets for HeranbaIndustries HERANBA_BE are 259.88 and 287.63 | Monthly Target 1 | 236.75 | | Monthly Target 2 | 255.25 | | Monthly Target 3 | 264.5 | | Monthly Target 4 | 283 | | Monthly Target 5 | 292.25 |
Monthly price and volumes Heranba Industries
| Date |
Closing |
Open |
Range |
Volume |
| Mon 19 May 2025 |
273.75 (7.52%) |
253.00 |
246.00 - 273.75 |
0.2487 times |
| Wed 30 April 2025 |
254.61 (19.39%) |
214.00 |
213.00 - 287.46 |
0.7455 times |
| Fri 28 March 2025 |
213.26 (0%) |
244.00 |
208.00 - 246.95 |
2.0058 times |
| Mon 19 May 2025 |
(0%) |
|
- |
0 times |

DMA SMA EMA moving averages of Heranba Industries HERANBA_BE
DMA (daily moving average) of Heranba Industries HERANBA_BE
| DMA period | DMA value | | 5 day DMA | 263.46 | | 12 day DMA | 258.64 | | 20 day DMA | 262.59 | | 35 day DMA | 248.88 | | 50 day DMA | | | 100 day DMA | | | 150 day DMA | | | 200 day DMA | | EMA (exponential moving average) of Heranba Industries HERANBA_BE
| EMA period | EMA current | EMA prev | EMA prev2 | | 5 day EMA | 265.3 | 261.08 | 257.42 | | 12 day EMA | 260.63 | 258.25 | 256.4 | | 20 day EMA | 257.05 | 255.29 | 253.91 | | 35 day EMA | 247.4 | 245.85 | 244.52 | | 50 day EMA | 0 | 0 | 0 |
SMA (simple moving average) of Heranba Industries HERANBA_BE
| SMA period | SMA current | SMA prev | SMA prev2 | | 5 day SMA | 263.46 | 258.89 | 254.41 | | 12 day SMA | 258.64 | 257.04 | 256.33 | | 20 day SMA | 262.59 | 261.32 | 259.73 | | 35 day SMA | 248.88 | 247.6 | 246.32 | | 50 day SMA | | 100 day SMA | | 150 day SMA | | 200 day SMA |
|
|
