GsmFoils GSMFOILS_ST full analysis,charts,indicators,moving averages,SMA,DMA,EMA,ADX,MACD,RSIGsm Foils GSMFOILS_ST WideScreen charts, DMA,SMA,EMA technical analysis, forecast prediction, by indicators ADX,MACD,RSI,CCI NSE stock exchange
Daily price and charts and targets GsmFoils Strong Daily Stock price targets for GsmFoils GSMFOILS_ST are 214.03 and 225.98 | Daily Target 1 | 212.03 | | Daily Target 2 | 216.02 | | Daily Target 3 | 223.98333333333 | | Daily Target 4 | 227.97 | | Daily Target 5 | 235.93 |
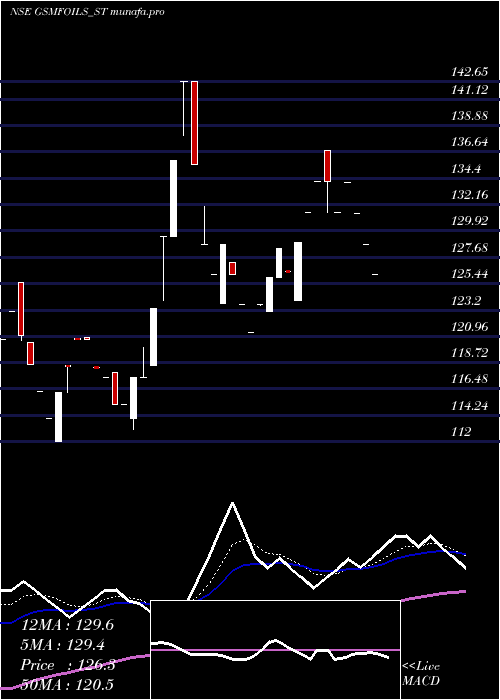
Daily price and volume Gsm Foils
| Date |
Closing |
Open |
Range |
Volume |
Fri 29 August 2025 |
220.00 (-3.51%) |
228.00 |
220.00 - 231.95 |
0.2832 times |
Thu 28 August 2025 |
228.00 (1.09%) |
212.00 |
210.35 - 228.00 |
1.0675 times |
Tue 26 August 2025 |
225.55 (4.86%) |
206.10 |
204.35 - 225.85 |
1.6776 times |
Mon 25 August 2025 |
215.10 (-4.99%) |
221.00 |
215.10 - 221.00 |
0.5447 times |
Fri 22 August 2025 |
226.40 (-4.05%) |
247.70 |
224.15 - 247.70 |
1.4379 times |
Thu 21 August 2025 |
235.95 (4.98%) |
229.00 |
228.00 - 235.95 |
0.719 times |
Wed 20 August 2025 |
224.75 (-4.91%) |
238.70 |
224.55 - 244.90 |
1.1983 times |
Tue 19 August 2025 |
236.35 (5%) |
232.00 |
221.50 - 236.35 |
1.3725 times |
Mon 18 August 2025 |
225.10 (4.99%) |
225.00 |
219.00 - 225.10 |
0.9368 times |
Thu 14 August 2025 |
214.40 (1.95%) |
210.40 |
210.40 - 214.50 |
0.7625 times |
Wed 13 August 2025 |
210.30 (1.99%) |
209.90 |
209.90 - 210.30 |
1.024 times |
Weekly price and charts GsmFoils Strong weekly Stock price targets for GsmFoils GSMFOILS_ST are 198.38 and 225.98 | Weekly Target 1 | 191.17 | | Weekly Target 2 | 205.58 | | Weekly Target 3 | 218.76666666667 | | Weekly Target 4 | 233.18 | | Weekly Target 5 | 246.37 |
Weekly price and volumes for Gsm Foils
| Date |
Closing |
Open |
Range |
Volume |
Fri 29 August 2025 |
220.00 (-2.83%) |
221.00 |
204.35 - 231.95 |
0.9458 times |
Fri 22 August 2025 |
226.40 (5.6%) |
225.00 |
219.00 - 247.70 |
1.4994 times |
Thu 14 August 2025 |
214.40 (3.93%) |
202.20 |
200.05 - 214.50 |
0.8708 times |
Fri 08 August 2025 |
206.30 (-6.5%) |
225.05 |
206.20 - 226.50 |
0.7901 times |
Fri 01 August 2025 |
220.65 (9.5%) |
205.50 |
205.50 - 220.65 |
1.6782 times |
Fri 25 July 2025 |
201.50 (6.05%) |
193.80 |
193.80 - 207.80 |
1.3149 times |
Fri 18 July 2025 |
190.00 (2.7%) |
184.95 |
183.95 - 195.55 |
0.5075 times |
Fri 11 July 2025 |
185.00 (14.73%) |
169.30 |
169.25 - 195.90 |
1.5167 times |
Fri 04 July 2025 |
161.25 (2.32%) |
158.90 |
155.00 - 164.95 |
0.5306 times |
Fri 27 June 2025 |
157.60 (3.68%) |
152.00 |
148.00 - 166.85 |
0.346 times |
Fri 20 June 2025 |
152.00 (0.33%) |
151.50 |
148.50 - 160.00 |
0.7901 times |

Monthly price and charts GsmFoils Strong monthly Stock price targets for GsmFoils GSMFOILS_ST are 186.2 and 233.85 | Monthly Target 1 | 174.93 | | Monthly Target 2 | 197.47 | | Monthly Target 3 | 222.58333333333 | | Monthly Target 4 | 245.12 | | Monthly Target 5 | 270.23 |
Monthly price and volumes Gsm Foils
| Date |
Closing |
Open |
Range |
Volume |
Fri 29 August 2025 |
220.00 (1.69%) |
220.65 |
200.05 - 247.70 |
1.386 times |
Thu 31 July 2025 |
216.35 (31.92%) |
163.20 |
156.00 - 216.35 |
1.7063 times |
Mon 30 June 2025 |
164.00 (9.33%) |
153.00 |
133.10 - 166.85 |
1.1182 times |
Fri 30 May 2025 |
150.00 (11.77%) |
136.80 |
129.50 - 164.00 |
0.8897 times |
Wed 30 April 2025 |
134.20 (9.24%) |
128.00 |
116.00 - 142.65 |
0.5282 times |
Fri 28 March 2025 |
122.85 (-0.89%) |
117.75 |
110.70 - 125.00 |
0.4121 times |
Fri 28 February 2025 |
123.95 (-3.5%) |
126.50 |
123.75 - 136.75 |
0.678 times |
Fri 31 January 2025 |
128.45 (10.54%) |
118.45 |
113.00 - 142.65 |
1.0526 times |
Tue 31 December 2024 |
116.20 (21.8%) |
97.30 |
97.30 - 125.50 |
0.7942 times |
Fri 29 November 2024 |
95.40 (14.73%) |
85.00 |
80.05 - 99.40 |
1.4347 times |
Thu 31 October 2024 |
83.15 (5.92%) |
76.05 |
75.05 - 89.30 |
1.858 times |

DMA SMA EMA moving averages of Gsm Foils GSMFOILS_ST
DMA (daily moving average) of Gsm Foils GSMFOILS_ST
| DMA period | DMA value | | 5 day DMA | 223.01 | | 12 day DMA | 222.34 | | 20 day DMA | 219.06 | | 35 day DMA | 209.33 | | 50 day DMA | 195.12 | | 100 day DMA | 169.01 | | 150 day DMA | 154.22 | | 200 day DMA | 141.11 | EMA (exponential moving average) of Gsm Foils GSMFOILS_ST
| EMA period | EMA current | EMA prev | EMA prev2 | | 5 day EMA | 223.51 | 225.27 | 223.91 | | 12 day EMA | 221.66 | 221.96 | 220.86 | | 20 day EMA | 217.22 | 216.93 | 215.77 | | 35 day EMA | 206.05 | 205.23 | 203.89 | | 50 day EMA | 194.42 | 193.38 | 191.97 |
SMA (simple moving average) of Gsm Foils GSMFOILS_ST
| SMA period | SMA current | SMA prev | SMA prev2 | | 5 day SMA | 223.01 | 226.2 | 225.55 | | 12 day SMA | 222.34 | 220.86 | 219.05 | | 20 day SMA | 219.06 | 218.67 | 217.67 | | 35 day SMA | 209.33 | 208.37 | 206.94 | | 50 day SMA | 195.12 | 193.84 | 192.32 | | 100 day SMA | 169.01 | 167.98 | 166.87 | | 150 day SMA | 154.22 | 153.53 | 152.8 | | 200 day SMA | 141.11 | 140.42 | 139.7 |
|
|
