GokulRefoils GOKUL_BE full analysis,charts,indicators,moving averages,SMA,DMA,EMA,ADX,MACD,RSIGokul Refoils GOKUL_BE WideScreen charts, DMA,SMA,EMA technical analysis, forecast prediction, by indicators ADX,MACD,RSI,CCI NSE stock exchange
Daily price and charts and targets GokulRefoils Strong Daily Stock price targets for GokulRefoils GOKUL_BE are 50.73 and 53.38 | Daily Target 1 | 50.22 | | Daily Target 2 | 51.23 | | Daily Target 3 | 52.866666666667 | | Daily Target 4 | 53.88 | | Daily Target 5 | 55.52 |
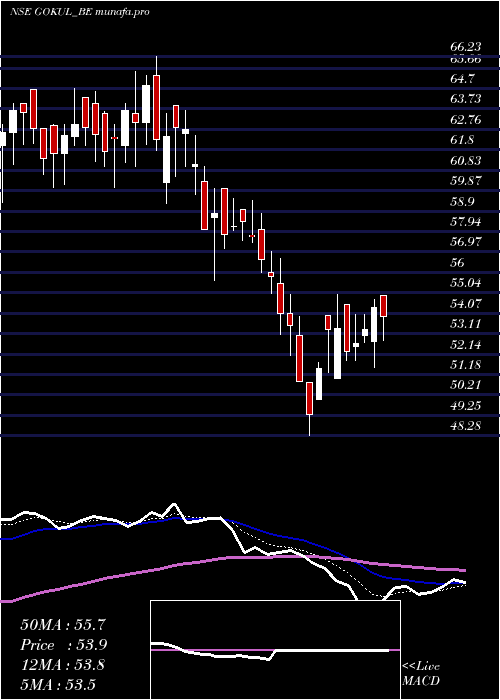
Daily price and volume Gokul Refoils
| Date |
Closing |
Open |
Range |
Volume |
Mon 03 February 2025 |
52.25 (-2.06%) |
54.50 |
51.85 - 54.50 |
0.4141 times |
Fri 31 January 2025 |
53.35 (0.11%) |
51.00 |
51.00 - 54.98 |
0.9518 times |
Thu 30 January 2025 |
53.29 (3.6%) |
53.95 |
51.25 - 53.95 |
0.4102 times |
Wed 29 January 2025 |
51.44 (4.34%) |
50.00 |
50.00 - 51.75 |
0.6539 times |
Tue 28 January 2025 |
49.30 (-3.01%) |
50.79 |
48.28 - 50.79 |
1.9683 times |
Mon 27 January 2025 |
50.83 (-5.01%) |
53.00 |
50.83 - 53.93 |
1.1452 times |
Fri 24 January 2025 |
53.51 (-1%) |
54.05 |
52.05 - 54.98 |
0.924 times |
Thu 23 January 2025 |
54.05 (-3.19%) |
55.49 |
53.05 - 56.65 |
1.7557 times |
Wed 22 January 2025 |
55.83 (-1.38%) |
56.00 |
55.00 - 56.98 |
0.9998 times |
Tue 21 January 2025 |
56.61 (-1.89%) |
58.01 |
56.00 - 58.79 |
0.777 times |
Mon 20 January 2025 |
57.70 (-1.23%) |
57.75 |
57.40 - 59.40 |
0.9848 times |
Weekly price and charts GokulRefoils Strong weekly Stock price targets for GokulRefoils GOKUL_BE are 50.73 and 53.38 | Weekly Target 1 | 50.22 | | Weekly Target 2 | 51.23 | | Weekly Target 3 | 52.866666666667 | | Weekly Target 4 | 53.88 | | Weekly Target 5 | 55.52 |
Weekly price and volumes for Gokul Refoils
| Date |
Closing |
Open |
Range |
Volume |
Mon 03 February 2025 |
52.25 (-2.06%) |
54.50 |
51.85 - 54.50 |
0.0402 times |
Fri 31 January 2025 |
53.35 (-0.3%) |
53.00 |
48.28 - 54.98 |
0.4978 times |
Fri 24 January 2025 |
53.51 (-8.4%) |
57.75 |
52.05 - 59.40 |
0.528 times |
Fri 17 January 2025 |
58.42 (-4.37%) |
60.30 |
55.60 - 60.99 |
0.5814 times |
Fri 10 January 2025 |
61.09 (-5.75%) |
65.30 |
59.25 - 66.23 |
0.7604 times |
Fri 03 January 2025 |
64.82 (3.68%) |
63.50 |
60.01 - 65.50 |
1.4707 times |
Fri 27 December 2024 |
62.52 (1.44%) |
61.60 |
60.15 - 64.70 |
1.2426 times |
Fri 20 December 2024 |
61.63 (-1.57%) |
62.61 |
60.01 - 64.66 |
1.3683 times |
Fri 13 December 2024 |
62.61 (2.89%) |
63.00 |
59.30 - 64.83 |
1.4908 times |
Fri 06 December 2024 |
60.85 (11.75%) |
55.19 |
53.00 - 63.00 |
2.0198 times |
Fri 29 November 2024 |
54.45 (0.67%) |
54.90 |
52.09 - 57.00 |
1.1124 times |

Monthly price and charts GokulRefoils Strong monthly Stock price targets for GokulRefoils GOKUL_BE are 50.73 and 53.38 | Monthly Target 1 | 50.22 | | Monthly Target 2 | 51.23 | | Monthly Target 3 | 52.866666666667 | | Monthly Target 4 | 53.88 | | Monthly Target 5 | 55.52 |
Monthly price and volumes Gokul Refoils
| Date |
Closing |
Open |
Range |
Volume |
Mon 03 February 2025 |
52.25 (-2.06%) |
54.50 |
51.85 - 54.50 |
0.0055 times |
Fri 31 January 2025 |
53.35 (-14.41%) |
62.00 |
48.28 - 66.23 |
0.4681 times |
Tue 31 December 2024 |
62.33 (14.47%) |
55.19 |
53.00 - 64.83 |
0.889 times |
Fri 29 November 2024 |
54.45 (37.78%) |
65.95 |
52.05 - 66.14 |
0.8595 times |
Fri 19 July 2024 |
39.52 (0.82%) |
37.24 |
37.24 - 40.65 |
0.8248 times |
Fri 28 June 2024 |
39.20 (-5.2%) |
40.55 |
38.45 - 44.00 |
0.6912 times |
Fri 31 May 2024 |
41.35 (-1.08%) |
42.10 |
39.60 - 47.80 |
1.6167 times |
Tue 30 April 2024 |
41.80 (20.98%) |
34.55 |
34.55 - 45.25 |
0.87 times |
Thu 28 March 2024 |
34.55 (-20.76%) |
44.75 |
33.90 - 46.80 |
1.7655 times |
Thu 29 February 2024 |
43.60 (-30.13%) |
63.85 |
41.30 - 63.85 |
2.0097 times |
Wed 31 January 2024 |
62.40 (387.5%) |
62.20 |
59.95 - 64.00 |
0.3918 times |

DMA SMA EMA moving averages of Gokul Refoils GOKUL_BE
DMA (daily moving average) of Gokul Refoils GOKUL_BE
| DMA period | DMA value | | 5 day DMA | 51.93 | | 12 day DMA | 53.88 | | 20 day DMA | 56.43 | | 35 day DMA | 59.15 | | 50 day DMA | 58.98 | | 100 day DMA | 51.33 | | 150 day DMA | 47.64 | | 200 day DMA | 43.57 | EMA (exponential moving average) of Gokul Refoils GOKUL_BE
| EMA period | EMA current | EMA prev | EMA prev2 | | 5 day EMA | 52.58 | 52.74 | 52.44 | | 12 day EMA | 53.95 | 54.26 | 54.43 | | 20 day EMA | 55.5 | 55.84 | 56.1 | | 35 day EMA | 56.75 | 57.02 | 57.24 | | 50 day EMA | 58.02 | 58.26 | 58.46 |
SMA (simple moving average) of Gokul Refoils GOKUL_BE
| SMA period | SMA current | SMA prev | SMA prev2 | | 5 day SMA | 51.93 | 51.64 | 51.67 | | 12 day SMA | 53.88 | 54.37 | 54.74 | | 20 day SMA | 56.43 | 56.93 | 57.5 | | 35 day SMA | 59.15 | 59.44 | 59.7 | | 50 day SMA | 58.98 | 59.01 | 59.02 | | 100 day SMA | 51.33 | 51.25 | 51.13 | | 150 day SMA | 47.64 | 47.6 | 47.54 | | 200 day SMA | 43.57 | 43.37 | 43.16 |
|
|
