GillandersArbuthnot GILLANDERS_BE full analysis,charts,indicators,moving averages,SMA,DMA,EMA,ADX,MACD,RSIGillanders Arbuthnot GILLANDERS_BE WideScreen charts, DMA,SMA,EMA technical analysis, forecast prediction, by indicators ADX,MACD,RSI,CCI NSE stock exchange
Daily price and charts and targets GillandersArbuthnot Strong Daily Stock price targets for GillandersArbuthnot GILLANDERS_BE are 110.41 and 115.33 | Daily Target 1 | 106.99 | | Daily Target 2 | 108.9 | | Daily Target 3 | 111.91 | | Daily Target 4 | 113.82 | | Daily Target 5 | 116.83 |
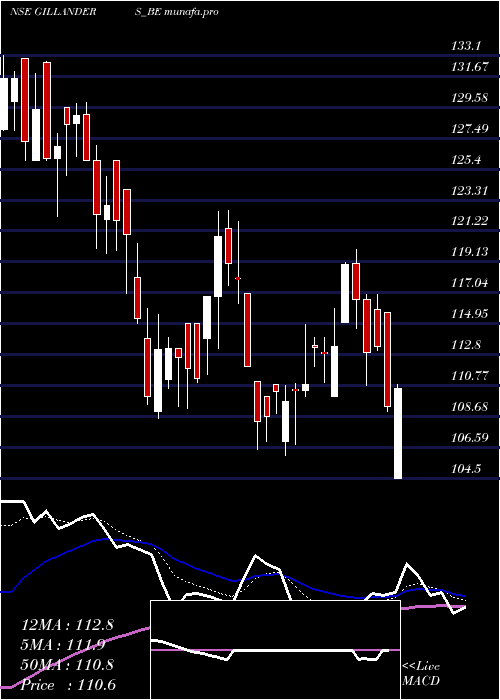
Daily price and volume Gillanders Arbuthnot
| Date |
Closing |
Open |
Range |
Volume |
Tue 04 February 2025 |
110.81 (0.33%) |
110.45 |
110.00 - 114.92 |
1.4638 times |
Mon 03 February 2025 |
110.45 (0.73%) |
110.50 |
106.80 - 110.90 |
0.3599 times |
Fri 31 January 2025 |
109.65 (-0.63%) |
107.00 |
106.00 - 110.73 |
1.7939 times |
Thu 30 January 2025 |
110.35 (1.53%) |
110.85 |
108.88 - 110.85 |
0.15 times |
Wed 29 January 2025 |
108.69 (0.34%) |
110.00 |
107.00 - 110.00 |
0.529 times |
Tue 28 January 2025 |
108.32 (-3.35%) |
111.01 |
106.46 - 111.01 |
0.9811 times |
Mon 27 January 2025 |
112.07 (-5%) |
117.00 |
112.07 - 117.00 |
0.6184 times |
Fri 24 January 2025 |
117.97 (-0.87%) |
118.01 |
116.30 - 121.89 |
0.9703 times |
Thu 23 January 2025 |
119.00 (-1.51%) |
121.40 |
117.54 - 122.60 |
0.5011 times |
Wed 22 January 2025 |
120.83 (3.49%) |
116.80 |
113.30 - 122.55 |
2.6325 times |
Tue 21 January 2025 |
116.76 (4.96%) |
113.95 |
111.51 - 116.80 |
3.9001 times |
Weekly price and charts GillandersArbuthnot Strong weekly Stock price targets for GillandersArbuthnot GILLANDERS_BE are 108.81 and 116.93 | Weekly Target 1 | 102.72 | | Weekly Target 2 | 106.77 | | Weekly Target 3 | 110.84333333333 | | Weekly Target 4 | 114.89 | | Weekly Target 5 | 118.96 |
Weekly price and volumes for Gillanders Arbuthnot
| Date |
Closing |
Open |
Range |
Volume |
Tue 04 February 2025 |
110.81 (1.06%) |
110.50 |
106.80 - 114.92 |
0.2179 times |
Fri 31 January 2025 |
109.65 (-7.05%) |
117.00 |
106.00 - 117.00 |
0.4866 times |
Fri 24 January 2025 |
117.97 (5.44%) |
114.99 |
111.00 - 122.60 |
1.0082 times |
Fri 17 January 2025 |
111.88 (-2.94%) |
113.95 |
108.50 - 115.98 |
0.9183 times |
Fri 10 January 2025 |
115.27 (-8.52%) |
126.00 |
114.94 - 127.00 |
1.1001 times |
Fri 03 January 2025 |
126.01 (-2.64%) |
132.60 |
122.22 - 132.70 |
0.8185 times |
Fri 27 December 2024 |
129.43 (1.07%) |
128.10 |
126.00 - 133.10 |
1.3359 times |
Fri 20 December 2024 |
128.06 (56.27%) |
135.00 |
128.00 - 136.36 |
2.6083 times |
Fri 24 May 2024 |
81.95 (-1.92%) |
81.25 |
80.10 - 83.70 |
0.4707 times |
Sat 18 May 2024 |
83.55 (2.39%) |
80.05 |
76.60 - 83.95 |
1.0354 times |
Fri 10 May 2024 |
81.60 (-5.88%) |
86.05 |
81.60 - 86.15 |
0.1817 times |

Monthly price and charts GillandersArbuthnot Strong monthly Stock price targets for GillandersArbuthnot GILLANDERS_BE are 108.81 and 116.93 | Monthly Target 1 | 102.72 | | Monthly Target 2 | 106.77 | | Monthly Target 3 | 110.84333333333 | | Monthly Target 4 | 114.89 | | Monthly Target 5 | 118.96 |
Monthly price and volumes Gillanders Arbuthnot
| Date |
Closing |
Open |
Range |
Volume |
Tue 04 February 2025 |
110.81 (1.06%) |
110.50 |
106.80 - 114.92 |
0.0352 times |
Fri 31 January 2025 |
109.65 (-13.61%) |
129.60 |
106.00 - 129.95 |
0.6229 times |
Tue 31 December 2024 |
126.93 (54.89%) |
135.00 |
122.22 - 136.36 |
0.713 times |
Fri 24 May 2024 |
81.95 (-6.66%) |
87.80 |
76.60 - 87.80 |
0.2789 times |
Tue 30 April 2024 |
87.80 (23.4%) |
72.95 |
71.75 - 90.00 |
0.5092 times |
Thu 28 March 2024 |
71.15 (-21.9%) |
91.10 |
70.00 - 104.45 |
2.3406 times |
Thu 29 February 2024 |
91.10 (-33.79%) |
140.00 |
88.85 - 144.60 |
2.0546 times |
Wed 31 January 2024 |
137.60 (43.26%) |
148.90 |
136.35 - 150.40 |
0.4222 times |
Mon 06 November 2023 |
96.05 (11.1%) |
88.95 |
87.40 - 96.05 |
0.4006 times |
Tue 31 October 2023 |
86.45 (77.88%) |
51.00 |
48.05 - 107.50 |
2.6228 times |
Thu 30 September 2021 |
48.60 (0.52%) |
49.90 |
43.35 - 49.90 |
0.5275 times |

DMA SMA EMA moving averages of Gillanders Arbuthnot GILLANDERS_BE
DMA (daily moving average) of Gillanders Arbuthnot GILLANDERS_BE
| DMA period | DMA value | | 5 day DMA | 109.99 | | 12 day DMA | 113.01 | | 20 day DMA | 113.77 | | 35 day DMA | 120.08 | | 50 day DMA | 109.68 | | 100 day DMA | 98.13 | | 150 day DMA | 97.26 | | 200 day DMA | 85.03 | EMA (exponential moving average) of Gillanders Arbuthnot GILLANDERS_BE
| EMA period | EMA current | EMA prev | EMA prev2 | | 5 day EMA | 110.69 | 110.63 | 110.72 | | 12 day EMA | 112.28 | 112.55 | 112.93 | | 20 day EMA | 113.28 | 113.54 | 113.87 | | 35 day EMA | 110.18 | 110.14 | 110.12 | | 50 day EMA | 107.84 | 107.72 | 107.61 |
SMA (simple moving average) of Gillanders Arbuthnot GILLANDERS_BE
| SMA period | SMA current | SMA prev | SMA prev2 | | 5 day SMA | 109.99 | 109.49 | 109.82 | | 12 day SMA | 113.01 | 113.1 | 113.28 | | 20 day SMA | 113.77 | 114.38 | 114.97 | | 35 day SMA | 120.08 | 120.78 | 119.96 | | 50 day SMA | 109.68 | 109.18 | 108.7 | | 100 day SMA | 98.13 | 98.14 | 98.18 | | 150 day SMA | 97.26 | 96.82 | 96.37 | | 200 day SMA | 85.03 | 84.62 | 84.21 |
|
|
