GePower GEPIL full analysis,charts,indicators,moving averages,SMA,DMA,EMA,ADX,MACD,RSIGe Power GEPIL WideScreen charts, DMA,SMA,EMA technical analysis, forecast prediction, by indicators ADX,MACD,RSI,CCI NSE stock exchange
operates under Heavy Electrical Equipment sector
Daily price and charts and targets GePower Strong Daily Stock price targets for GePower GEPIL are 309.78 and 321.28 | Daily Target 1 | 300.58 | | Daily Target 2 | 307.47 | | Daily Target 3 | 312.08333333333 | | Daily Target 4 | 318.97 | | Daily Target 5 | 323.58 |
Daily price and volume Ge Power
| Date |
Closing |
Open |
Range |
Volume |
Fri 04 July 2025 |
314.35 (1.83%) |
308.00 |
305.20 - 316.70 |
0.8224 times |
Thu 03 July 2025 |
308.70 (-0.77%) |
311.20 |
307.50 - 313.25 |
0.4868 times |
Wed 02 July 2025 |
311.10 (-1.27%) |
320.70 |
307.50 - 325.55 |
1.4831 times |
Tue 01 July 2025 |
315.10 (0.7%) |
315.80 |
311.10 - 318.00 |
0.5452 times |
Mon 30 June 2025 |
312.90 (-1.12%) |
317.45 |
310.50 - 322.55 |
0.7638 times |
Fri 27 June 2025 |
316.45 (0.27%) |
315.00 |
315.00 - 321.35 |
0.6789 times |
Thu 26 June 2025 |
315.60 (-2.19%) |
324.45 |
313.45 - 327.60 |
0.7802 times |
Wed 25 June 2025 |
322.65 (3.61%) |
313.25 |
313.15 - 326.50 |
1.42 times |
Tue 24 June 2025 |
311.40 (1.88%) |
311.40 |
307.00 - 320.10 |
1.9352 times |
Mon 23 June 2025 |
305.65 (0.59%) |
300.95 |
298.65 - 312.55 |
1.0844 times |
Fri 20 June 2025 |
303.85 (1.61%) |
300.90 |
298.20 - 308.65 |
0.8292 times |
Weekly price and charts GePower Strong weekly Stock price targets for GePower GEPIL are 299.6 and 319.95 | Weekly Target 1 | 294.68 | | Weekly Target 2 | 304.52 | | Weekly Target 3 | 315.03333333333 | | Weekly Target 4 | 324.87 | | Weekly Target 5 | 335.38 |
Weekly price and volumes for Ge Power
| Date |
Closing |
Open |
Range |
Volume |
Fri 04 July 2025 |
314.35 (-0.66%) |
317.45 |
305.20 - 325.55 |
0.4757 times |
Fri 27 June 2025 |
316.45 (4.15%) |
300.95 |
298.65 - 327.60 |
0.6842 times |
Fri 20 June 2025 |
303.85 (-3.86%) |
318.00 |
297.55 - 323.95 |
0.5395 times |
Fri 13 June 2025 |
316.05 (15.92%) |
275.00 |
273.00 - 345.00 |
4.0379 times |
Fri 06 June 2025 |
272.65 (6.96%) |
257.25 |
253.20 - 298.00 |
1.9421 times |
Fri 30 May 2025 |
254.92 (3.34%) |
249.30 |
247.55 - 267.08 |
0.7863 times |
Fri 23 May 2025 |
246.68 (-0.86%) |
254.00 |
238.30 - 254.89 |
0.3572 times |
Fri 16 May 2025 |
248.81 (14.07%) |
227.90 |
225.11 - 250.74 |
0.5061 times |
Fri 09 May 2025 |
218.12 (-3.87%) |
230.90 |
212.40 - 239.65 |
0.3553 times |
Fri 02 May 2025 |
226.89 (-6.89%) |
247.35 |
225.30 - 255.00 |
0.3157 times |
Fri 25 April 2025 |
243.69 (-6.49%) |
264.20 |
240.80 - 269.90 |
0.7884 times |
Monthly price and charts GePower Strong monthly Stock price targets for GePower GEPIL are 299.6 and 319.95 | Monthly Target 1 | 294.68 | | Monthly Target 2 | 304.52 | | Monthly Target 3 | 315.03333333333 | | Monthly Target 4 | 324.87 | | Monthly Target 5 | 335.38 |
Monthly price and volumes Ge Power
| Date |
Closing |
Open |
Range |
Volume |
Fri 04 July 2025 |
314.35 (0.46%) |
315.80 |
305.20 - 325.55 |
0.1911 times |
Mon 30 June 2025 |
312.90 (22.74%) |
257.25 |
253.20 - 345.00 |
3.6006 times |
Fri 30 May 2025 |
254.92 (10.62%) |
233.80 |
212.40 - 267.08 |
1.0186 times |
Wed 30 April 2025 |
230.45 (-7.73%) |
247.00 |
205.25 - 271.80 |
1.1763 times |
Fri 28 March 2025 |
249.76 (6.39%) |
235.35 |
223.60 - 279.30 |
1.1008 times |
Fri 28 February 2025 |
234.75 (-19.08%) |
285.30 |
220.05 - 289.00 |
0.7304 times |
Fri 31 January 2025 |
290.10 (-23.41%) |
380.20 |
265.60 - 388.75 |
0.4814 times |
Tue 31 December 2024 |
378.75 (-9.63%) |
417.00 |
365.00 - 457.00 |
0.5745 times |
Fri 29 November 2024 |
419.10 (22.62%) |
342.00 |
339.70 - 422.30 |
0.7074 times |
Thu 31 October 2024 |
341.80 (-33.54%) |
354.65 |
311.20 - 425.05 |
0.4189 times |
Mon 15 July 2024 |
514.30 (24.27%) |
418.30 |
404.00 - 646.00 |
3.4892 times |
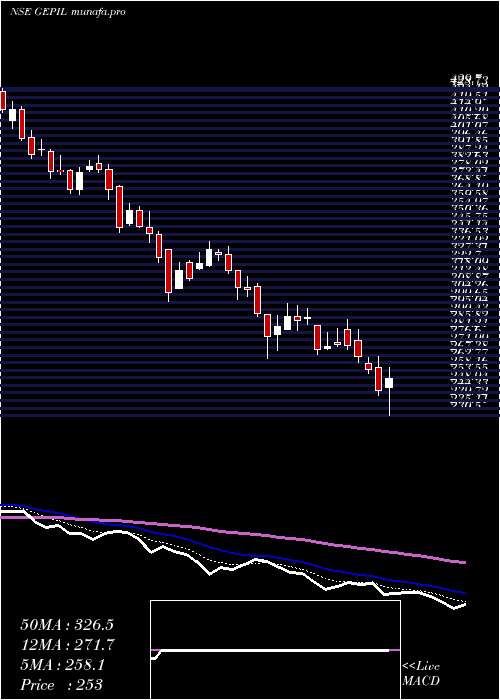
DMA SMA EMA moving averages of Ge Power GEPIL
DMA (daily moving average) of Ge Power GEPIL
| DMA period | DMA value | | 5 day DMA | 312.43 | | 12 day DMA | 311.4 | | 20 day DMA | 312.6 | | 35 day DMA | 290.21 | | 50 day DMA | 273.56 | | 100 day DMA | 261.07 | | 150 day DMA | 295.67 | | 200 day DMA | 323.61 | EMA (exponential moving average) of Ge Power GEPIL
| EMA period | EMA current | EMA prev | EMA prev2 | | 5 day EMA | 312.64 | 311.78 | 313.32 | | 12 day EMA | 311.08 | 310.49 | 310.81 | | 20 day EMA | 305.58 | 304.66 | 304.24 | | 35 day EMA | 292.44 | 291.15 | 290.12 | | 50 day EMA | 276.2 | 274.64 | 273.25 |
SMA (simple moving average) of Ge Power GEPIL
| SMA period | SMA current | SMA prev | SMA prev2 | | 5 day SMA | 312.43 | 312.85 | 314.23 | | 12 day SMA | 311.4 | 311.03 | 311.29 | | 20 day SMA | 312.6 | 310.51 | 308.83 | | 35 day SMA | 290.21 | 288.34 | 286.53 | | 50 day SMA | 273.56 | 272.36 | 271.34 | | 100 day SMA | 261.07 | 260.67 | 260.31 | | 150 day SMA | 295.67 | 296.26 | 296.85 | | 200 day SMA | 323.61 | 324.08 | 324.5 |
|
|
