GensolEngineering GENSOL_BE full analysis,charts,indicators,moving averages,SMA,DMA,EMA,ADX,MACD,RSIGensol Engineering GENSOL_BE WideScreen charts, DMA,SMA,EMA technical analysis, forecast prediction, by indicators ADX,MACD,RSI,CCI NSE stock exchange
Daily price and charts and targets GensolEngineering Strong Daily Stock price targets for GensolEngineering GENSOL_BE are 48.98 and 48.98 | Daily Target 1 | 48.98 | | Daily Target 2 | 48.98 | | Daily Target 3 | 48.98 | | Daily Target 4 | 48.98 | | Daily Target 5 | 48.98 |
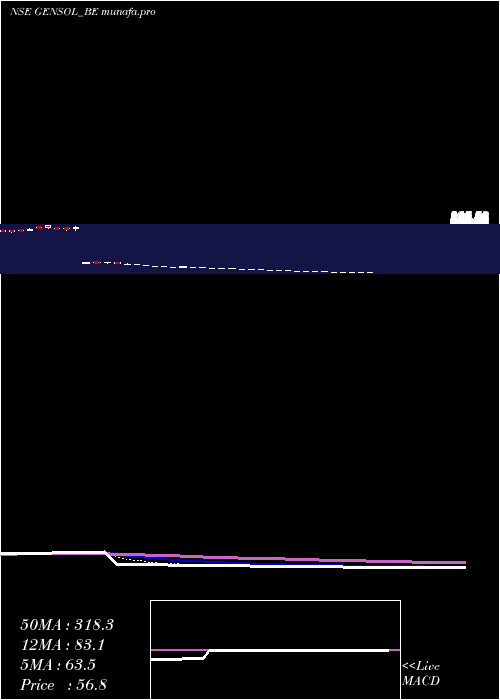
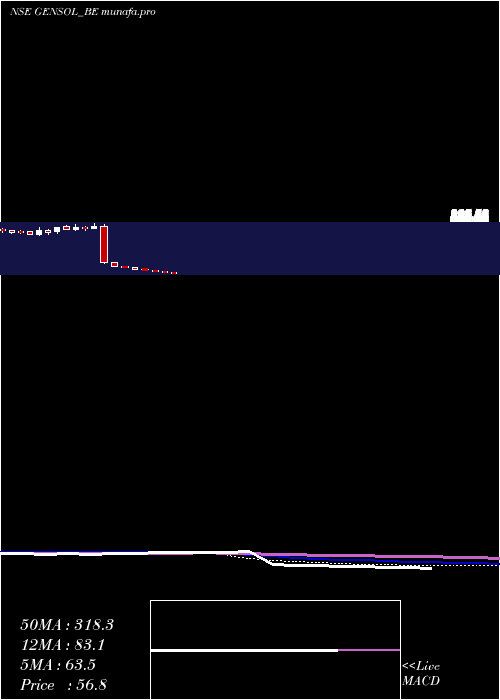
Daily price and volume Gensol Engineering
| Date |
Closing |
Open |
Range |
Volume |
Thu 03 July 2025 |
48.98 (4.99%) |
48.98 |
48.98 - 48.98 |
0.1982 times |
Wed 02 July 2025 |
46.65 (5%) |
46.65 |
46.65 - 46.65 |
0.1841 times |
Tue 01 July 2025 |
44.43 (4.99%) |
44.43 |
44.43 - 44.43 |
0.645 times |
Mon 30 June 2025 |
42.32 (4.99%) |
40.31 |
40.31 - 42.32 |
5.5668 times |
Fri 27 June 2025 |
40.31 (-2.02%) |
40.31 |
40.31 - 40.31 |
1.2017 times |
Thu 26 June 2025 |
41.14 (-2%) |
41.14 |
41.14 - 41.14 |
0.2992 times |
Wed 25 June 2025 |
41.98 (-2.01%) |
41.98 |
41.98 - 41.98 |
0.2985 times |
Tue 24 June 2025 |
42.84 (-2.01%) |
42.84 |
42.84 - 42.85 |
1.1796 times |
Mon 23 June 2025 |
43.72 (-2.02%) |
43.72 |
43.72 - 43.72 |
0.1972 times |
Fri 20 June 2025 |
44.62 (-2.02%) |
44.62 |
44.62 - 44.62 |
0.2297 times |
Thu 19 June 2025 |
45.54 (-2%) |
45.54 |
45.54 - 45.54 |
0.1554 times |
Weekly price and charts GensolEngineering Strong weekly Stock price targets for GensolEngineering GENSOL_BE are 44.65 and 53.32 | Weekly Target 1 | 37.42 | | Weekly Target 2 | 43.2 | | Weekly Target 3 | 46.09 | | Weekly Target 4 | 51.87 | | Weekly Target 5 | 54.76 |
Weekly price and volumes for Gensol Engineering
| Date |
Closing |
Open |
Range |
Volume |
Thu 03 July 2025 |
48.98 (21.51%) |
40.31 |
40.31 - 48.98 |
0.8392 times |
Fri 27 June 2025 |
40.31 (-9.66%) |
43.72 |
40.31 - 43.72 |
0.4042 times |
Fri 20 June 2025 |
44.62 (-9.64%) |
48.39 |
44.62 - 48.39 |
0.1955 times |
Fri 13 June 2025 |
49.38 (-9.64%) |
53.55 |
49.38 - 53.55 |
0.573 times |
Fri 06 June 2025 |
54.65 (-9.64%) |
59.27 |
54.65 - 59.27 |
0.9484 times |
Fri 30 May 2025 |
60.48 (-9.64%) |
65.59 |
60.48 - 65.59 |
0.7504 times |
Fri 23 May 2025 |
66.93 (2.09%) |
68.83 |
66.93 - 70.20 |
2.2355 times |
Fri 16 May 2025 |
65.56 (15.44%) |
53.95 |
51.25 - 65.56 |
3.5907 times |
Fri 09 May 2025 |
56.79 (-22.65%) |
69.74 |
56.79 - 69.74 |
0.2794 times |
Fri 02 May 2025 |
73.42 (-18.57%) |
85.65 |
73.42 - 85.65 |
0.1837 times |
Fri 25 April 2025 |
90.16 (-22.64%) |
110.71 |
90.16 - 110.71 |
0.3126 times |
Monthly price and charts GensolEngineering Strong monthly Stock price targets for GensolEngineering GENSOL_BE are 46.71 and 51.26 | Monthly Target 1 | 42.91 | | Monthly Target 2 | 45.95 | | Monthly Target 3 | 47.463333333333 | | Monthly Target 4 | 50.5 | | Monthly Target 5 | 52.01 |
Monthly price and volumes Gensol Engineering
| Date |
Closing |
Open |
Range |
Volume |
Thu 03 July 2025 |
48.98 (15.74%) |
44.43 |
44.43 - 48.98 |
0.0456 times |
Mon 30 June 2025 |
42.32 (-30.03%) |
59.27 |
40.31 - 59.27 |
0.9875 times |
Fri 30 May 2025 |
60.48 (-21.75%) |
73.42 |
51.25 - 73.42 |
2.4168 times |
Wed 30 April 2025 |
77.29 (-58.11%) |
175.27 |
77.29 - 175.27 |
2.2653 times |
Fri 28 March 2025 |
184.50 (-79.32%) |
224.90 |
184.50 - 256.00 |
1.4144 times |
Tue 30 January 2024 |
892.35 (5.53%) |
860.05 |
800.00 - 922.00 |
0.4183 times |
Fri 29 December 2023 |
845.55 (8.7%) |
793.00 |
708.90 - 846.90 |
0.277 times |
Thu 30 November 2023 |
777.85 (0%) |
797.25 |
743.90 - 836.45 |
0.1752 times |
Thu 03 July 2025 |
(0%) |
|
- |
0 times |

DMA SMA EMA moving averages of Gensol Engineering GENSOL_BE
DMA (daily moving average) of Gensol Engineering GENSOL_BE
| DMA period | DMA value | | 5 day DMA | 44.54 | | 12 day DMA | 44.08 | | 20 day DMA | 46.83 | | 35 day DMA | 54.04 | | 50 day DMA | 58.84 | | 100 day DMA | 312.03 | | 150 day DMA | | | 200 day DMA | | EMA (exponential moving average) of Gensol Engineering GENSOL_BE
| EMA period | EMA current | EMA prev | EMA prev2 | | 5 day EMA | 45.76 | 44.15 | 42.9 | | 12 day EMA | 45.68 | 45.08 | 44.8 | | 20 day EMA | 48.28 | 48.21 | 48.37 | | 35 day EMA | 54.87 | 55.22 | 55.72 | | 50 day EMA | 62.2 | 62.74 | 63.4 |
SMA (simple moving average) of Gensol Engineering GENSOL_BE
| SMA period | SMA current | SMA prev | SMA prev2 | | 5 day SMA | 44.54 | 42.97 | 42.04 | | 12 day SMA | 44.08 | 43.95 | 44.1 | | 20 day SMA | 46.83 | 47.17 | 47.69 | | 35 day SMA | 54.04 | 54.42 | 54.79 | | 50 day SMA | 58.84 | 59.96 | 61.25 | | 100 day SMA | 312.03 | 319.49 | 327.19 | | 150 day SMA | | 200 day SMA |
|
|
