FelixIndustries FELIX_ST full analysis,charts,indicators,moving averages,SMA,DMA,EMA,ADX,MACD,RSIFelix Industries FELIX_ST WideScreen charts, DMA,SMA,EMA technical analysis, forecast prediction, by indicators ADX,MACD,RSI,CCI NSE stock exchange
Daily price and charts and targets FelixIndustries Strong Daily Stock price targets for FelixIndustries FELIX_ST are 170.45 and 180.4 | Daily Target 1 | 162.35 | | Daily Target 2 | 168.6 | | Daily Target 3 | 172.3 | | Daily Target 4 | 178.55 | | Daily Target 5 | 182.25 |
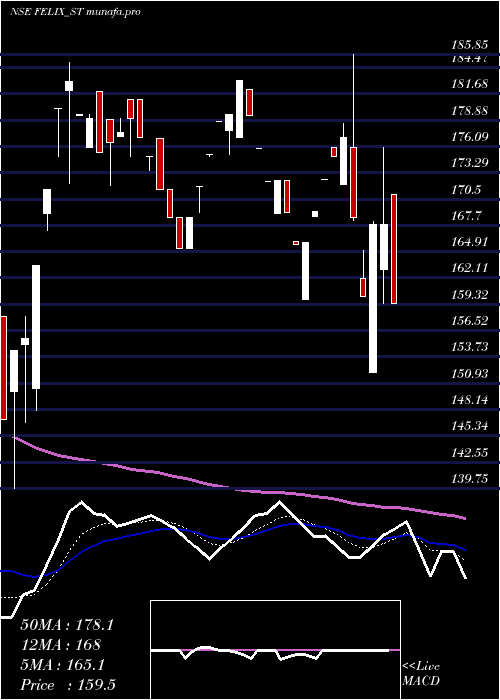
Daily price and volume Felix Industries
| Date |
Closing |
Open |
Range |
Volume |
Thu 03 July 2025 |
174.85 (3.1%) |
170.00 |
166.05 - 176.00 |
0.8576 times |
Wed 02 July 2025 |
169.60 (-0.88%) |
169.00 |
166.00 - 170.95 |
0.3602 times |
Tue 01 July 2025 |
171.10 (-2.89%) |
175.50 |
167.40 - 175.95 |
1.2521 times |
Mon 30 June 2025 |
176.20 (-0.84%) |
176.00 |
172.00 - 178.00 |
0.5317 times |
Fri 27 June 2025 |
177.70 (-2.55%) |
178.50 |
175.00 - 182.00 |
0.3945 times |
Thu 26 June 2025 |
182.35 (2.96%) |
178.85 |
178.85 - 184.00 |
2.0412 times |
Wed 25 June 2025 |
177.10 (4.58%) |
173.30 |
170.00 - 177.80 |
1.2007 times |
Tue 24 June 2025 |
169.35 (-1.05%) |
167.00 |
167.00 - 172.80 |
0.6518 times |
Mon 23 June 2025 |
171.15 (-4.89%) |
171.10 |
170.95 - 178.00 |
0.8919 times |
Fri 20 June 2025 |
179.95 (0.14%) |
185.00 |
171.55 - 185.00 |
1.8182 times |
Thu 19 June 2025 |
179.70 (5%) |
175.00 |
172.75 - 179.70 |
2.6244 times |
Weekly price and charts FelixIndustries Strong weekly Stock price targets for FelixIndustries FELIX_ST are 164.43 and 176.43 | Weekly Target 1 | 160.95 | | Weekly Target 2 | 167.9 | | Weekly Target 3 | 172.95 | | Weekly Target 4 | 179.9 | | Weekly Target 5 | 184.95 |
Weekly price and volumes for Felix Industries
| Date |
Closing |
Open |
Range |
Volume |
Thu 03 July 2025 |
174.85 (-1.6%) |
176.00 |
166.00 - 178.00 |
0.6503 times |
Fri 27 June 2025 |
177.70 (-1.25%) |
171.10 |
167.00 - 184.00 |
1.1223 times |
Fri 20 June 2025 |
179.95 (9.76%) |
166.00 |
162.00 - 185.00 |
1.5942 times |
Fri 13 June 2025 |
163.95 (2.05%) |
162.25 |
158.05 - 170.00 |
0.8584 times |
Fri 06 June 2025 |
160.65 (-2.04%) |
171.20 |
160.00 - 171.20 |
0.6317 times |
Fri 30 May 2025 |
164.00 (-0.91%) |
165.50 |
160.20 - 169.95 |
0.7841 times |
Fri 23 May 2025 |
165.50 (2.89%) |
163.00 |
153.20 - 171.95 |
1.5013 times |
Fri 16 May 2025 |
160.85 (0.75%) |
160.40 |
160.15 - 175.45 |
0.5723 times |
Fri 09 May 2025 |
159.65 (-1.72%) |
158.00 |
153.25 - 169.00 |
0.7767 times |
Fri 02 May 2025 |
162.45 (5.49%) |
170.00 |
157.20 - 170.00 |
1.5087 times |
Fri 21 February 2025 |
154.00 (-3.42%) |
166.50 |
145.70 - 166.50 |
0.9996 times |

Monthly price and charts FelixIndustries Strong monthly Stock price targets for FelixIndustries FELIX_ST are 165.43 and 175.43 | Monthly Target 1 | 162.28 | | Monthly Target 2 | 168.57 | | Monthly Target 3 | 172.28333333333 | | Monthly Target 4 | 178.57 | | Monthly Target 5 | 182.28 |
Monthly price and volumes Felix Industries
| Date |
Closing |
Open |
Range |
Volume |
Thu 03 July 2025 |
174.85 (-0.77%) |
175.50 |
166.00 - 176.00 |
0.1193 times |
Mon 30 June 2025 |
176.20 (7.44%) |
171.20 |
158.05 - 185.00 |
0.9634 times |
Fri 30 May 2025 |
164.00 (2.92%) |
158.00 |
153.20 - 175.45 |
0.859 times |
Wed 30 April 2025 |
159.35 (3.47%) |
170.00 |
157.20 - 170.00 |
0.2874 times |
Fri 21 February 2025 |
154.00 (-7.06%) |
159.85 |
145.70 - 185.85 |
0.6362 times |
Fri 31 January 2025 |
165.70 (-9.43%) |
179.30 |
165.20 - 183.05 |
0.9882 times |
Tue 31 December 2024 |
182.95 (5.6%) |
170.00 |
139.75 - 187.75 |
3.8179 times |
Fri 29 November 2024 |
173.25 (-20.09%) |
220.00 |
173.25 - 236.00 |
0.6975 times |
Thu 31 October 2024 |
216.80 (-35.67%) |
248.00 |
180.00 - 255.00 |
1.472 times |
Mon 22 April 2024 |
337.00 (1.2%) |
317.00 |
307.00 - 366.50 |
0.159 times |
Thu 28 March 2024 |
333.00 (-10.96%) |
355.30 |
308.85 - 373.05 |
0.1756 times |

DMA SMA EMA moving averages of Felix Industries FELIX_ST
DMA (daily moving average) of Felix Industries FELIX_ST
| DMA period | DMA value | | 5 day DMA | 173.89 | | 12 day DMA | 175.02 | | 20 day DMA | 170.44 | | 35 day DMA | 167.24 | | 50 day DMA | 165.86 | | 100 day DMA | 167.26 | | 150 day DMA | 185.92 | | 200 day DMA | | EMA (exponential moving average) of Felix Industries FELIX_ST
| EMA period | EMA current | EMA prev | EMA prev2 | | 5 day EMA | 173.66 | 173.07 | 174.8 | | 12 day EMA | 173.04 | 172.71 | 173.27 | | 20 day EMA | 171.3 | 170.93 | 171.07 | | 35 day EMA | 168.79 | 168.43 | 168.36 | | 50 day EMA | 166.11 | 165.75 | 165.59 |
SMA (simple moving average) of Felix Industries FELIX_ST
| SMA period | SMA current | SMA prev | SMA prev2 | | 5 day SMA | 173.89 | 175.39 | 176.89 | | 12 day SMA | 175.02 | 174.03 | 173.5 | | 20 day SMA | 170.44 | 169.84 | 169.45 | | 35 day SMA | 167.24 | 166.9 | 166.88 | | 50 day SMA | 165.86 | 165.45 | 165.13 | | 100 day SMA | 167.26 | 167.25 | 167.38 | | 150 day SMA | 185.92 | 186.9 | 187.92 | | 200 day SMA |
|
|
