ExcelRealty EXCEL_BE full analysis,charts,indicators,moving averages,SMA,DMA,EMA,ADX,MACD,RSIExcel Realty EXCEL_BE WideScreen charts, DMA,SMA,EMA technical analysis, forecast prediction, by indicators ADX,MACD,RSI,CCI NSE stock exchange
Daily price and charts and targets ExcelRealty Strong Daily Stock price targets for ExcelRealty EXCEL_BE are 1.4 and 1.52 | Daily Target 1 | 1.3 | | Daily Target 2 | 1.37 | | Daily Target 3 | 1.4166666666667 | | Daily Target 4 | 1.49 | | Daily Target 5 | 1.54 |
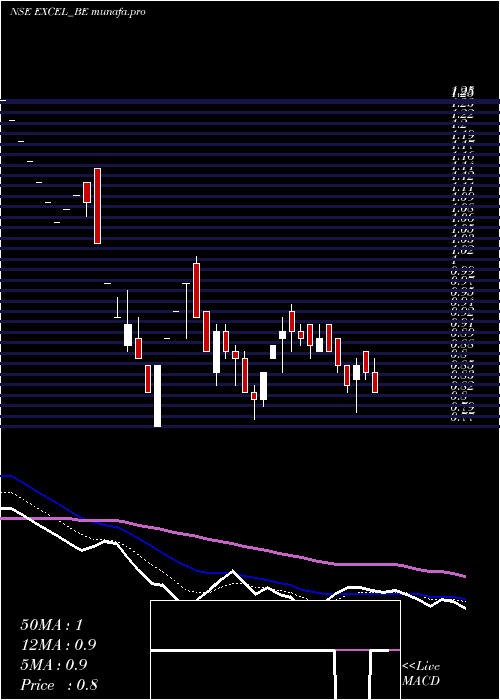
Daily price and volume Excel Realty
| Date |
Closing |
Open |
Range |
Volume |
Tue 04 November 2025 |
1.45 (2.84%) |
1.39 |
1.34 - 1.46 |
0.9759 times |
Mon 03 November 2025 |
1.41 (-5.37%) |
1.48 |
1.41 - 1.48 |
1.2298 times |
Fri 31 October 2025 |
1.49 (-2.61%) |
1.55 |
1.48 - 1.55 |
0.6293 times |
Thu 30 October 2025 |
1.53 (1.32%) |
1.50 |
1.46 - 1.55 |
0.8712 times |
Wed 29 October 2025 |
1.51 (-3.82%) |
1.56 |
1.49 - 1.59 |
1.4036 times |
Tue 28 October 2025 |
1.57 (0%) |
1.57 |
1.52 - 1.61 |
1.1438 times |
Mon 27 October 2025 |
1.57 (-0.63%) |
1.58 |
1.55 - 1.63 |
0.797 times |
Fri 24 October 2025 |
1.58 (-0.63%) |
1.59 |
1.53 - 1.65 |
1.19 times |
Thu 23 October 2025 |
1.59 (2.58%) |
1.55 |
1.55 - 1.62 |
1.2658 times |
Tue 21 October 2025 |
1.55 (4.03%) |
1.47 |
1.44 - 1.56 |
0.4936 times |
Mon 20 October 2025 |
1.49 (-3.87%) |
1.55 |
1.48 - 1.61 |
1.4173 times |
Weekly price and charts ExcelRealty Strong weekly Stock price targets for ExcelRealty EXCEL_BE are 1.33 and 1.47 | Weekly Target 1 | 1.28 | | Weekly Target 2 | 1.37 | | Weekly Target 3 | 1.4233333333333 | | Weekly Target 4 | 1.51 | | Weekly Target 5 | 1.56 |
Weekly price and volumes for Excel Realty
| Date |
Closing |
Open |
Range |
Volume |
Tue 04 November 2025 |
1.45 (-2.68%) |
1.48 |
1.34 - 1.48 |
0.4972 times |
Fri 31 October 2025 |
1.49 (-5.7%) |
1.58 |
1.46 - 1.63 |
1.092 times |
Fri 24 October 2025 |
1.58 (1.94%) |
1.55 |
1.44 - 1.65 |
0.9842 times |
Fri 17 October 2025 |
1.55 (-6.63%) |
1.66 |
1.33 - 1.68 |
1.9955 times |
Fri 10 October 2025 |
1.66 (-3.49%) |
1.68 |
1.60 - 1.68 |
0.887 times |
Fri 03 October 2025 |
1.72 (7.5%) |
1.63 |
1.63 - 1.72 |
0.4503 times |
Fri 26 September 2025 |
1.60 (0.63%) |
1.55 |
1.51 - 1.60 |
1.7052 times |
Fri 19 September 2025 |
1.59 (-3.64%) |
1.68 |
1.59 - 1.74 |
1.3551 times |
Fri 12 September 2025 |
1.65 (10%) |
1.53 |
1.53 - 1.65 |
0.3313 times |
Fri 05 September 2025 |
1.50 (7.14%) |
1.42 |
1.42 - 1.50 |
0.7022 times |
Fri 29 August 2025 |
1.40 (6.06%) |
1.34 |
1.34 - 1.40 |
0.5146 times |

Monthly price and charts ExcelRealty Strong monthly Stock price targets for ExcelRealty EXCEL_BE are 1.33 and 1.47 | Monthly Target 1 | 1.28 | | Monthly Target 2 | 1.37 | | Monthly Target 3 | 1.4233333333333 | | Monthly Target 4 | 1.51 | | Monthly Target 5 | 1.56 |
Monthly price and volumes Excel Realty
| Date |
Closing |
Open |
Range |
Volume |
Tue 04 November 2025 |
1.45 (-2.68%) |
1.48 |
1.34 - 1.48 |
0.1334 times |
Fri 31 October 2025 |
1.49 (-10.24%) |
1.69 |
1.33 - 1.72 |
1.3834 times |
Tue 30 September 2025 |
1.66 (18.57%) |
1.42 |
1.42 - 1.74 |
1.1657 times |
Fri 29 August 2025 |
1.40 (17.65%) |
1.22 |
1.03 - 1.40 |
1.018 times |
Thu 31 July 2025 |
1.19 (60.81%) |
1.08 |
0.96 - 1.28 |
0.7591 times |
Fri 04 April 2025 |
0.74 (0%) |
0.77 |
0.72 - 0.78 |
0.1044 times |
Fri 28 March 2025 |
0.74 (-2.63%) |
0.75 |
0.72 - 0.88 |
0.7446 times |
Fri 28 February 2025 |
0.76 (-16.48%) |
0.94 |
0.75 - 0.95 |
0.8723 times |
Fri 31 January 2025 |
0.91 (-14.95%) |
1.09 |
0.77 - 1.15 |
3.4495 times |
Tue 31 December 2024 |
1.07 (-39.55%) |
1.73 |
1.07 - 1.73 |
0.3695 times |
Fri 29 November 2024 |
1.77 (129.87%) |
1.34 |
1.29 - 1.85 |
0.8188 times |

DMA SMA EMA moving averages of Excel Realty EXCEL_BE
DMA (daily moving average) of Excel Realty EXCEL_BE
| DMA period | DMA value | | 5 day DMA | 1.48 | | 12 day DMA | 1.52 | | 20 day DMA | 1.54 | | 35 day DMA | 1.58 | | 50 day DMA | 1.55 | | 100 day DMA | 1.25 | | 150 day DMA | 1.17 | | 200 day DMA | 1.14 | EMA (exponential moving average) of Excel Realty EXCEL_BE
| EMA period | EMA current | EMA prev | EMA prev2 | | 5 day EMA | 1.47 | 1.48 | 1.52 | | 12 day EMA | 1.51 | 1.52 | 1.54 | | 20 day EMA | 1.52 | 1.53 | 1.54 | | 35 day EMA | 1.52 | 1.52 | 1.53 | | 50 day EMA | 1.52 | 1.52 | 1.52 |
SMA (simple moving average) of Excel Realty EXCEL_BE
| SMA period | SMA current | SMA prev | SMA prev2 | | 5 day SMA | 1.48 | 1.5 | 1.53 | | 12 day SMA | 1.52 | 1.53 | 1.53 | | 20 day SMA | 1.54 | 1.55 | 1.57 | | 35 day SMA | 1.58 | 1.58 | 1.59 | | 50 day SMA | 1.55 | 1.54 | 1.54 | | 100 day SMA | 1.25 | 1.24 | 1.24 | | 150 day SMA | 1.17 | 1.17 | 1.17 | | 200 day SMA | 1.14 | 1.14 | 1.14 |
|
|
