EnergyMission EMMIL_ST full analysis,charts,indicators,moving averages,SMA,DMA,EMA,ADX,MACD,RSIEnergy Mission EMMIL_ST WideScreen charts, DMA,SMA,EMA technical analysis, forecast prediction, by indicators ADX,MACD,RSI,CCI NSE stock exchange
Daily price and charts and targets EnergyMission Strong Daily Stock price targets for EnergyMission EMMIL_ST are 209.63 and 210.38 | Daily Target 1 | 209 | | Daily Target 2 | 209.5 | | Daily Target 3 | 209.75 | | Daily Target 4 | 210.25 | | Daily Target 5 | 210.5 |
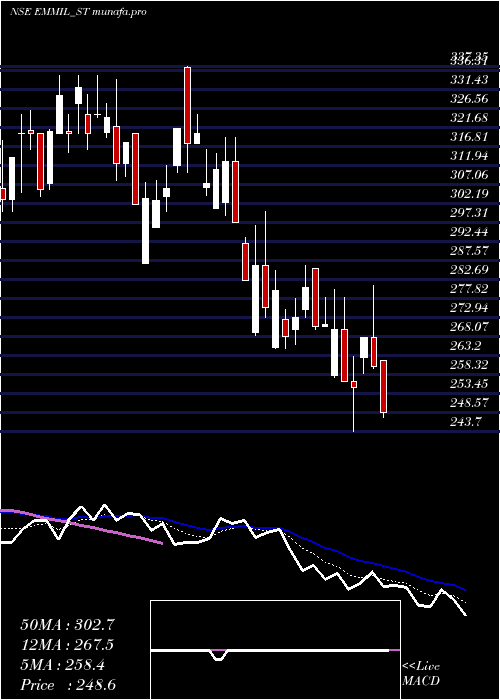
Daily price and volume Energy Mission
| Date |
Closing |
Open |
Range |
Volume |
Fri 09 May 2025 |
210.00 (-1.64%) |
209.25 |
209.25 - 210.00 |
0.5372 times |
Thu 08 May 2025 |
213.50 (-0.51%) |
211.00 |
210.30 - 213.55 |
0.8264 times |
Wed 07 May 2025 |
214.60 (-1.99%) |
214.60 |
214.60 - 214.60 |
0.2479 times |
Tue 06 May 2025 |
218.95 (-1.99%) |
219.00 |
218.95 - 219.00 |
0.0826 times |
Mon 05 May 2025 |
223.40 (-1.97%) |
227.90 |
223.40 - 227.90 |
0.3306 times |
Fri 02 May 2025 |
227.90 (-0.02%) |
232.50 |
227.90 - 232.50 |
0.4132 times |
Wed 30 April 2025 |
227.95 (1.99%) |
227.95 |
227.95 - 227.95 |
2.2727 times |
Tue 29 April 2025 |
223.50 (1.98%) |
223.50 |
223.50 - 223.50 |
0.8678 times |
Mon 28 April 2025 |
219.15 (1.98%) |
219.15 |
219.15 - 219.15 |
0.4132 times |
Fri 25 April 2025 |
214.90 (1.99%) |
214.90 |
210.00 - 214.90 |
4.0083 times |
Thu 24 April 2025 |
210.70 (4.02%) |
210.70 |
210.70 - 210.70 |
0.0826 times |
Weekly price and charts EnergyMission Strong weekly Stock price targets for EnergyMission EMMIL_ST are 200.3 and 218.95 | Weekly Target 1 | 197.07 | | Weekly Target 2 | 203.53 | | Weekly Target 3 | 215.71666666667 | | Weekly Target 4 | 222.18 | | Weekly Target 5 | 234.37 |
Weekly price and volumes for Energy Mission
| Date |
Closing |
Open |
Range |
Volume |
Fri 09 May 2025 |
210.00 (-7.85%) |
227.90 |
209.25 - 227.90 |
0.2046 times |
Fri 02 May 2025 |
227.90 (6.05%) |
219.15 |
219.15 - 232.50 |
0.4008 times |
Fri 25 April 2025 |
214.90 (10.35%) |
198.60 |
198.60 - 214.90 |
0.4509 times |
Thu 17 April 2025 |
194.75 (4.51%) |
190.05 |
187.00 - 194.75 |
0.238 times |
Fri 11 April 2025 |
186.35 (-7.52%) |
197.50 |
186.35 - 197.50 |
0.1336 times |
Fri 04 April 2025 |
201.50 (0.35%) |
196.80 |
196.80 - 204.70 |
0.1962 times |
Fri 28 March 2025 |
200.80 (-3.14%) |
217.65 |
197.00 - 217.65 |
0.7182 times |
Fri 21 March 2025 |
207.30 (16.1%) |
170.30 |
162.10 - 207.30 |
1.4489 times |
Thu 13 March 2025 |
178.55 (-14.98%) |
200.10 |
178.55 - 209.00 |
2.6263 times |
Fri 07 March 2025 |
210.00 (-2.14%) |
206.30 |
198.00 - 216.00 |
3.5825 times |
Fri 28 February 2025 |
214.60 (-5.75%) |
227.70 |
199.50 - 231.75 |
1.9332 times |

Monthly price and charts EnergyMission Strong monthly Stock price targets for EnergyMission EMMIL_ST are 198 and 221.25 | Monthly Target 1 | 194 | | Monthly Target 2 | 202 | | Monthly Target 3 | 217.25 | | Monthly Target 4 | 225.25 | | Monthly Target 5 | 240.5 |
Monthly price and volumes Energy Mission
| Date |
Closing |
Open |
Range |
Volume |
Fri 09 May 2025 |
210.00 (-7.87%) |
232.50 |
209.25 - 232.50 |
0.0218 times |
Wed 30 April 2025 |
227.95 (13.52%) |
196.80 |
186.35 - 227.95 |
0.1218 times |
Fri 28 March 2025 |
200.80 (-6.43%) |
206.30 |
162.10 - 217.65 |
0.7403 times |
Fri 28 February 2025 |
214.60 (-23.34%) |
272.50 |
199.50 - 286.15 |
0.4584 times |
Fri 31 January 2025 |
279.95 (-12.71%) |
320.00 |
265.00 - 337.35 |
0.4325 times |
Tue 31 December 2024 |
320.70 (-7.39%) |
346.30 |
300.00 - 354.25 |
0.3432 times |
Thu 30 May 2024 |
346.30 (0%) |
366.00 |
329.85 - 397.00 |
4.882 times |
Fri 09 May 2025 |
(0%) |
|
- |
0 times |

DMA SMA EMA moving averages of Energy Mission EMMIL_ST
DMA (daily moving average) of Energy Mission EMMIL_ST
| DMA period | DMA value | | 5 day DMA | 216.09 | | 12 day DMA | 217.26 | | 20 day DMA | 207.33 | | 35 day DMA | 202.86 | | 50 day DMA | 206.52 | | 100 day DMA | 255.22 | | 150 day DMA | | | 200 day DMA | | EMA (exponential moving average) of Energy Mission EMMIL_ST
| EMA period | EMA current | EMA prev | EMA prev2 | | 5 day EMA | 214.81 | 217.22 | 219.08 | | 12 day EMA | 214.1 | 214.85 | 215.09 | | 20 day EMA | 211.66 | 211.84 | 211.66 | | 35 day EMA | 211.5 | 211.59 | 211.48 | | 50 day EMA | 211.6 | 211.67 | 211.6 |
SMA (simple moving average) of Energy Mission EMMIL_ST
| SMA period | SMA current | SMA prev | SMA prev2 | | 5 day SMA | 216.09 | 219.67 | 222.56 | | 12 day SMA | 217.26 | 216.31 | 214.75 | | 20 day SMA | 207.33 | 206.91 | 206.47 | | 35 day SMA | 202.86 | 202.41 | 202.01 | | 50 day SMA | 206.52 | 207.29 | 208.23 | | 100 day SMA | 255.22 | 256.59 | 257.83 | | 150 day SMA | | 200 day SMA |
|
|
