ElgiRubber ELGIRUBCO_BE full analysis,charts,indicators,moving averages,SMA,DMA,EMA,ADX,MACD,RSIElgi Rubber ELGIRUBCO_BE WideScreen charts, DMA,SMA,EMA technical analysis, forecast prediction, by indicators ADX,MACD,RSI,CCI NSE stock exchange
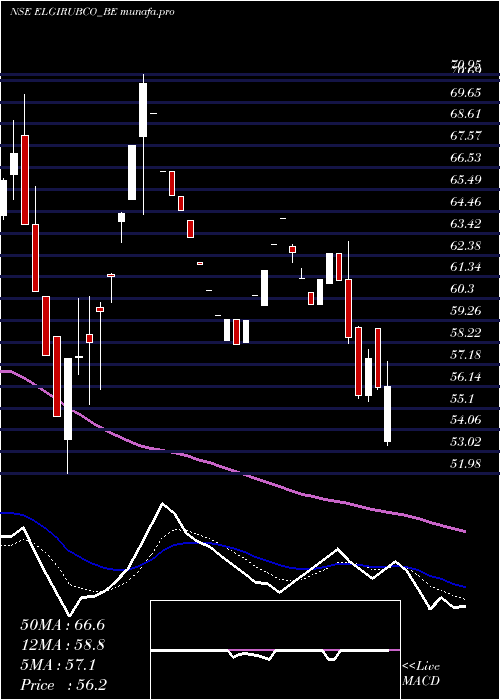
Daily price and charts and targets ElgiRubber Strong Daily Stock price targets for ElgiRubber ELGIRUBCO_BE are 55.56 and 58.57 | Daily Target 1 | 55.06 | | Daily Target 2 | 56.06 | | Daily Target 3 | 58.066666666667 | | Daily Target 4 | 59.07 | | Daily Target 5 | 61.08 |
Daily price and volume Elgi Rubber
| Date |
Closing |
Open |
Range |
Volume |
Fri 14 November 2025 |
57.07 (-4.99%) |
59.77 |
57.06 - 60.07 |
3.561 times |
Thu 13 November 2025 |
60.07 (-1.1%) |
60.89 |
59.80 - 61.00 |
0.3696 times |
Wed 12 November 2025 |
60.74 (1.62%) |
59.77 |
59.77 - 61.57 |
0.378 times |
Tue 11 November 2025 |
59.77 (-1.4%) |
60.57 |
59.05 - 60.59 |
0.3296 times |
Mon 10 November 2025 |
60.62 (-3.41%) |
62.05 |
60.00 - 62.05 |
1.1285 times |
Fri 07 November 2025 |
62.76 (-2.73%) |
65.10 |
61.50 - 65.10 |
1.0785 times |
Thu 06 November 2025 |
64.52 (-4.56%) |
67.60 |
64.22 - 68.27 |
0.4472 times |
Tue 04 November 2025 |
67.60 (-1.47%) |
66.60 |
66.20 - 68.55 |
0.5037 times |
Mon 03 November 2025 |
68.61 (0.07%) |
67.19 |
65.51 - 69.99 |
0.9847 times |
Fri 31 October 2025 |
68.56 (3.71%) |
68.30 |
67.00 - 69.15 |
1.2192 times |
Thu 30 October 2025 |
66.11 (4.67%) |
65.80 |
63.80 - 66.31 |
1.3407 times |
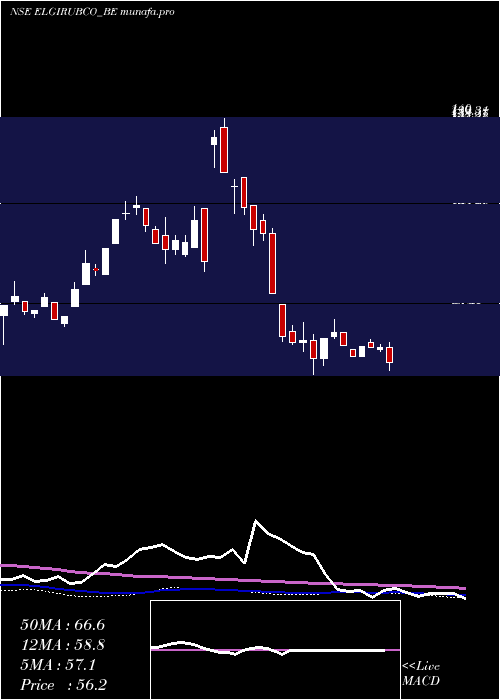
Weekly price and charts ElgiRubber Strong weekly Stock price targets for ElgiRubber ELGIRUBCO_BE are 54.57 and 59.56 | Weekly Target 1 | 53.74 | | Weekly Target 2 | 55.4 | | Weekly Target 3 | 58.726666666667 | | Weekly Target 4 | 60.39 | | Weekly Target 5 | 63.72 |
Weekly price and volumes for Elgi Rubber
| Date |
Closing |
Open |
Range |
Volume |
Fri 14 November 2025 |
57.07 (-9.07%) |
62.05 |
57.06 - 62.05 |
1.0801 times |
Fri 07 November 2025 |
62.76 (-8.46%) |
67.19 |
61.50 - 69.99 |
0.5646 times |
Fri 31 October 2025 |
68.56 (11.1%) |
62.94 |
59.11 - 69.15 |
1.1046 times |
Fri 24 October 2025 |
61.71 (-0.32%) |
61.91 |
60.10 - 63.94 |
0.5255 times |
Fri 17 October 2025 |
61.91 (-4.34%) |
64.00 |
59.20 - 66.00 |
0.773 times |
Fri 10 October 2025 |
64.72 (-1.85%) |
67.00 |
64.50 - 70.00 |
0.5981 times |
Fri 03 October 2025 |
65.94 (-4.78%) |
69.00 |
64.00 - 69.50 |
0.7741 times |
Fri 26 September 2025 |
69.25 (-2.49%) |
70.50 |
69.05 - 72.00 |
1.3009 times |
Fri 19 September 2025 |
71.02 (1.49%) |
69.60 |
69.15 - 72.69 |
1.0786 times |
Fri 12 September 2025 |
69.98 (-2.24%) |
74.00 |
69.00 - 74.95 |
2.2005 times |
Fri 05 September 2025 |
71.58 (25.98%) |
74.01 |
70.55 - 77.00 |
0.8523 times |
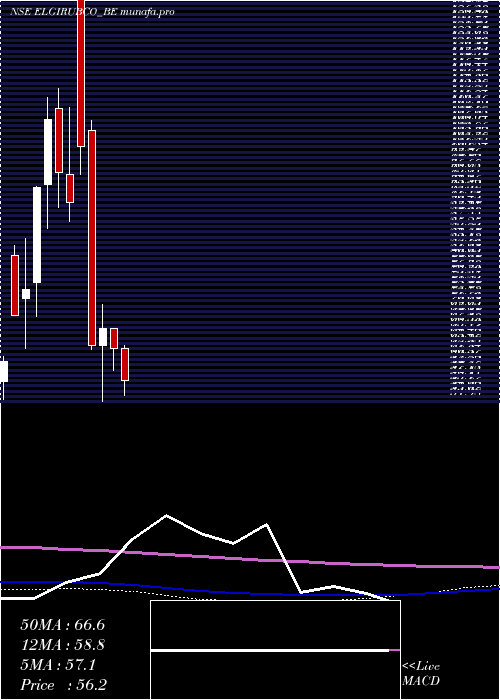
Monthly price and charts ElgiRubber Strong monthly Stock price targets for ElgiRubber ELGIRUBCO_BE are 50.6 and 63.53 | Monthly Target 1 | 48.44 | | Monthly Target 2 | 52.76 | | Monthly Target 3 | 61.373333333333 | | Monthly Target 4 | 65.69 | | Monthly Target 5 | 74.3 |
Monthly price and volumes Elgi Rubber
| Date |
Closing |
Open |
Range |
Volume |
Fri 14 November 2025 |
57.07 (-16.76%) |
67.19 |
57.06 - 69.99 |
0.3679 times |
Fri 31 October 2025 |
68.56 (5.33%) |
66.00 |
59.11 - 70.00 |
0.7584 times |
Tue 30 September 2025 |
65.09 (14.55%) |
74.01 |
65.00 - 77.00 |
1.3012 times |
Fri 22 August 2025 |
56.82 (5.81%) |
52.62 |
48.20 - 60.19 |
0.4562 times |
Thu 31 July 2025 |
53.70 (-11.39%) |
60.90 |
53.70 - 63.63 |
0.4275 times |
Mon 30 June 2025 |
60.60 (-3.04%) |
62.50 |
50.20 - 63.00 |
0.7422 times |
Fri 30 May 2025 |
62.50 (0.1%) |
62.44 |
53.31 - 69.50 |
0.9741 times |
Wed 30 April 2025 |
62.44 (-5.88%) |
66.34 |
58.10 - 66.34 |
0.303 times |
Fri 28 March 2025 |
66.34 (5.25%) |
63.00 |
51.98 - 70.95 |
2.8791 times |
Fri 28 February 2025 |
63.03 (-38.17%) |
105.00 |
62.25 - 107.00 |
1.7904 times |
Fri 31 January 2025 |
101.94 (12.1%) |
131.05 |
96.40 - 140.00 |
2.4302 times |
DMA SMA EMA moving averages of Elgi Rubber ELGIRUBCO_BE
DMA (daily moving average) of Elgi Rubber ELGIRUBCO_BE
| DMA period | DMA value | | 5 day DMA | 59.65 | | 12 day DMA | 63.3 | | 20 day DMA | 62.6 | | 35 day DMA | 64.13 | | 50 day DMA | 65.84 | | 100 day DMA | 61.33 | | 150 day DMA | 61.42 | | 200 day DMA | 67.27 | EMA (exponential moving average) of Elgi Rubber ELGIRUBCO_BE
| EMA period | EMA current | EMA prev | EMA prev2 | | 5 day EMA | 59.82 | 61.19 | 61.75 | | 12 day EMA | 61.72 | 62.56 | 63.01 | | 20 day EMA | 62.6 | 63.18 | 63.51 | | 35 day EMA | 63.66 | 64.05 | 64.28 | | 50 day EMA | 64.45 | 64.75 | 64.94 |
SMA (simple moving average) of Elgi Rubber ELGIRUBCO_BE
| SMA period | SMA current | SMA prev | SMA prev2 | | 5 day SMA | 59.65 | 60.79 | 61.68 | | 12 day SMA | 63.3 | 63.68 | 63.83 | | 20 day SMA | 62.6 | 62.86 | 62.97 | | 35 day SMA | 64.13 | 64.49 | 64.77 | | 50 day SMA | 65.84 | 65.84 | 65.81 | | 100 day SMA | 61.33 | 61.33 | 61.3 | | 150 day SMA | 61.42 | 61.49 | 61.52 | | 200 day SMA | 67.27 | 67.63 | 68 |
|
|
