ChandanHealthcare CHANDAN_ST full analysis,charts,indicators,moving averages,SMA,DMA,EMA,ADX,MACD,RSIChandan Healthcare CHANDAN_ST WideScreen charts, DMA,SMA,EMA technical analysis, forecast prediction, by indicators ADX,MACD,RSI,CCI NSE stock exchange
Daily price and charts and targets ChandanHealthcare Strong Daily Stock price targets for ChandanHealthcare CHANDAN_ST are 324.15 and 335.85 | Daily Target 1 | 315.73 | | Daily Target 2 | 320.87 | | Daily Target 3 | 327.43333333333 | | Daily Target 4 | 332.57 | | Daily Target 5 | 339.13 |
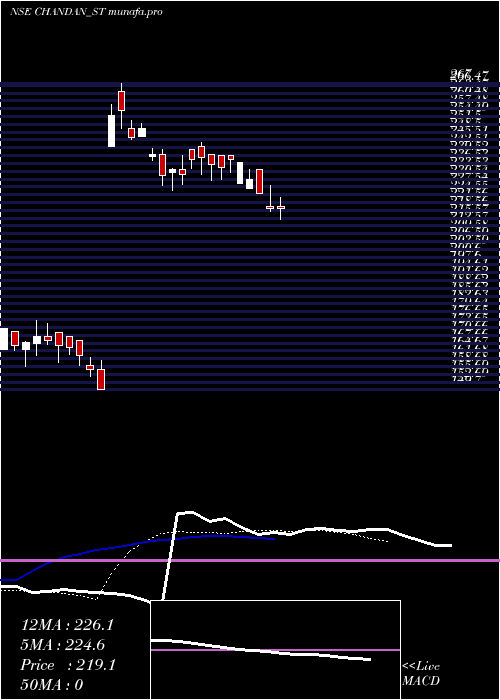
Daily price and volume Chandan Healthcare
| Date |
Closing |
Open |
Range |
Volume |
Fri 31 October 2025 |
326.00 (-3.91%) |
325.10 |
322.30 - 334.00 |
0.8023 times |
Thu 30 October 2025 |
339.25 (-0.89%) |
354.90 |
339.00 - 355.00 |
0.4068 times |
Wed 29 October 2025 |
342.30 (5%) |
330.00 |
330.00 - 342.30 |
0.8475 times |
Tue 28 October 2025 |
326.00 (2.63%) |
314.90 |
304.00 - 332.90 |
0.6441 times |
Mon 27 October 2025 |
317.65 (-4.94%) |
334.15 |
317.45 - 343.60 |
0.6667 times |
Fri 24 October 2025 |
334.15 (-1.43%) |
350.80 |
334.15 - 350.80 |
0.7571 times |
Thu 23 October 2025 |
339.00 (4.95%) |
338.90 |
330.00 - 339.15 |
2.7684 times |
Tue 21 October 2025 |
323.00 (4.99%) |
323.00 |
310.00 - 323.00 |
1.4011 times |
Mon 20 October 2025 |
307.65 (5%) |
301.00 |
300.00 - 307.65 |
1.5367 times |
Fri 17 October 2025 |
293.00 (-0.09%) |
300.00 |
293.00 - 300.00 |
0.1695 times |
Thu 16 October 2025 |
293.25 (-0.93%) |
292.60 |
281.20 - 296.45 |
0.8701 times |
Weekly price and charts ChandanHealthcare Strong weekly Stock price targets for ChandanHealthcare CHANDAN_ST are 289.5 and 340.5 | Weekly Target 1 | 277.33 | | Weekly Target 2 | 301.67 | | Weekly Target 3 | 328.33333333333 | | Weekly Target 4 | 352.67 | | Weekly Target 5 | 379.33 |
Weekly price and volumes for Chandan Healthcare
| Date |
Closing |
Open |
Range |
Volume |
Fri 31 October 2025 |
326.00 (-2.44%) |
334.15 |
304.00 - 355.00 |
0.6216 times |
Fri 24 October 2025 |
334.15 (14.04%) |
301.00 |
300.00 - 350.80 |
1.1932 times |
Fri 17 October 2025 |
293.00 (1.74%) |
302.40 |
281.20 - 317.50 |
2.0505 times |
Fri 10 October 2025 |
288.00 (23.82%) |
235.00 |
230.00 - 288.00 |
1.214 times |
Fri 03 October 2025 |
232.60 (-2.41%) |
229.00 |
224.50 - 245.00 |
0.3338 times |
Fri 26 September 2025 |
238.35 (5.98%) |
217.00 |
217.00 - 260.25 |
3.2207 times |
Fri 19 September 2025 |
224.90 (-0.35%) |
225.70 |
220.00 - 231.00 |
0.8156 times |
Fri 12 September 2025 |
225.70 (-1.38%) |
228.85 |
223.00 - 237.00 |
0.1502 times |
Fri 05 September 2025 |
228.85 (4.47%) |
219.05 |
210.00 - 230.50 |
0.1606 times |
Fri 29 August 2025 |
219.05 (-7.57%) |
227.00 |
215.00 - 234.00 |
0.2399 times |
Fri 22 August 2025 |
237.00 (-0.42%) |
243.00 |
229.00 - 244.40 |
0.1606 times |

Monthly price and charts ChandanHealthcare Strong monthly Stock price targets for ChandanHealthcare CHANDAN_ST are 277.75 and 403.25 | Monthly Target 1 | 178 | | Monthly Target 2 | 252 | | Monthly Target 3 | 303.5 | | Monthly Target 4 | 377.5 | | Monthly Target 5 | 429 |
Monthly price and volumes Chandan Healthcare
| Date |
Closing |
Open |
Range |
Volume |
Fri 31 October 2025 |
326.00 (41.13%) |
230.00 |
229.50 - 355.00 |
1.2897 times |
Tue 30 September 2025 |
231.00 (5.46%) |
219.05 |
210.00 - 260.25 |
1.0936 times |
Fri 29 August 2025 |
219.05 (46.33%) |
243.00 |
215.00 - 267.00 |
0.1936 times |
Mon 03 March 2025 |
149.70 (-4.98%) |
157.55 |
149.70 - 160.80 |
0.0372 times |
Fri 28 February 2025 |
157.55 (0%) |
165.10 |
154.90 - 176.20 |
2.3859 times |
Tue 04 November 2025 |
(0%) |
|
- |
0 times |

DMA SMA EMA moving averages of Chandan Healthcare CHANDAN_ST
DMA (daily moving average) of Chandan Healthcare CHANDAN_ST
| DMA period | DMA value | | 5 day DMA | 330.24 | | 12 day DMA | 319.77 | | 20 day DMA | 299.64 | | 35 day DMA | 270.67 | | 50 day DMA | 257.9 | | 100 day DMA | | | 150 day DMA | | | 200 day DMA | | EMA (exponential moving average) of Chandan Healthcare CHANDAN_ST
| EMA period | EMA current | EMA prev | EMA prev2 | | 5 day EMA | 330.38 | 332.57 | 329.23 | | 12 day EMA | 318.58 | 317.23 | 313.23 | | 20 day EMA | 303.81 | 301.47 | 297.49 | | 35 day EMA | 284.13 | 281.66 | 278.27 | | 50 day EMA | 263.31 | 260.75 | 257.55 |
SMA (simple moving average) of Chandan Healthcare CHANDAN_ST
| SMA period | SMA current | SMA prev | SMA prev2 | | 5 day SMA | 330.24 | 331.87 | 331.82 | | 12 day SMA | 319.77 | 318.53 | 315.46 | | 20 day SMA | 299.64 | 294.84 | 289.43 | | 35 day SMA | 270.67 | 267.85 | 264.68 | | 50 day SMA | 257.9 | 256.1 | 254.09 | | 100 day SMA | | 150 day SMA | | 200 day SMA |
|
|
