BorosilRenewables BORORENEW_BE full analysis,charts,indicators,moving averages,SMA,DMA,EMA,ADX,MACD,RSIBorosil Renewables BORORENEW_BE WideScreen charts, DMA,SMA,EMA technical analysis, forecast prediction, by indicators ADX,MACD,RSI,CCI NSE stock exchange
Daily price and charts and targets BorosilRenewables Strong Daily Stock price targets for BorosilRenewables BORORENEW_BE are 502.8 and 530.2 | Daily Target 1 | 480.6 | | Daily Target 2 | 497.6 | | Daily Target 3 | 508 | | Daily Target 4 | 525 | | Daily Target 5 | 535.4 |
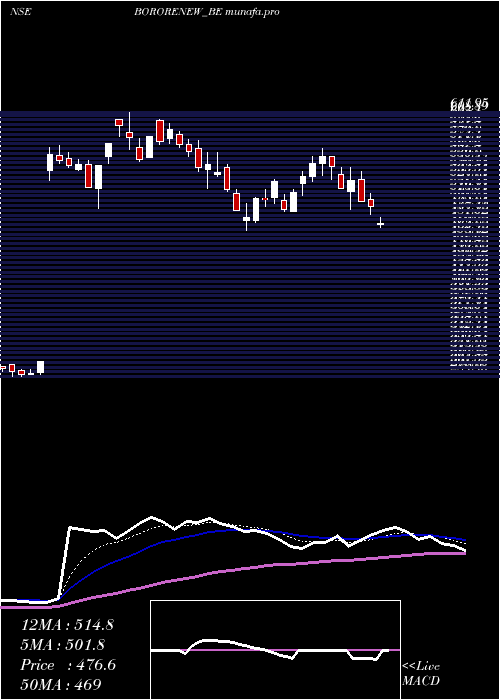
Daily price and volume Borosil Renewables
| Date |
Closing |
Open |
Range |
Volume |
Tue 04 February 2025 |
514.60 (4.17%) |
491.00 |
491.00 - 518.40 |
0.8028 times |
Mon 03 February 2025 |
494.00 (-6.49%) |
505.00 |
492.00 - 511.95 |
0.7144 times |
Fri 31 January 2025 |
528.30 (4.33%) |
508.00 |
501.50 - 531.00 |
0.8855 times |
Thu 30 January 2025 |
506.35 (-0.09%) |
506.80 |
498.00 - 518.00 |
0.7814 times |
Wed 29 January 2025 |
506.80 (4.59%) |
480.00 |
478.40 - 508.75 |
0.9175 times |
Tue 28 January 2025 |
484.55 (-1.61%) |
480.00 |
467.90 - 501.00 |
1.5949 times |
Mon 27 January 2025 |
492.50 (-4.99%) |
513.00 |
492.45 - 518.55 |
0.8806 times |
Fri 24 January 2025 |
518.35 (-3.93%) |
544.95 |
515.60 - 548.70 |
0.8503 times |
Thu 23 January 2025 |
539.55 (-1.77%) |
537.00 |
534.15 - 563.90 |
1.018 times |
Wed 22 January 2025 |
549.30 (0.78%) |
542.15 |
520.05 - 563.95 |
1.5545 times |
Tue 21 January 2025 |
545.05 (-3.41%) |
568.00 |
540.55 - 578.00 |
0.9075 times |
Weekly price and charts BorosilRenewables Strong weekly Stock price targets for BorosilRenewables BORORENEW_BE are 502.8 and 530.2 | Weekly Target 1 | 480.6 | | Weekly Target 2 | 497.6 | | Weekly Target 3 | 508 | | Weekly Target 4 | 525 | | Weekly Target 5 | 535.4 |
Weekly price and volumes for Borosil Renewables
| Date |
Closing |
Open |
Range |
Volume |
Tue 04 February 2025 |
514.60 (-2.59%) |
505.00 |
491.00 - 518.40 |
0.2701 times |
Fri 31 January 2025 |
528.30 (1.92%) |
513.00 |
467.90 - 531.00 |
0.9009 times |
Fri 24 January 2025 |
518.35 (-9.65%) |
573.00 |
515.60 - 578.95 |
0.9157 times |
Fri 17 January 2025 |
573.70 (-1.31%) |
570.00 |
552.25 - 604.00 |
1.4739 times |
Fri 10 January 2025 |
581.30 (6%) |
548.40 |
494.95 - 611.95 |
2.0672 times |
Fri 03 January 2025 |
548.40 (77.79%) |
542.00 |
529.60 - 571.80 |
1.006 times |
Thu 09 September 2021 |
308.45 (2.9%) |
305.00 |
289.95 - 308.45 |
0.6125 times |
Fri 03 September 2021 |
299.75 (-0.43%) |
309.00 |
289.00 - 309.00 |
0.7899 times |
Fri 27 August 2021 |
301.05 (4.49%) |
293.00 |
276.00 - 320.00 |
1.0938 times |
Fri 20 August 2021 |
288.10 (-8.86%) |
314.15 |
285.00 - 317.80 |
0.8701 times |
Fri 13 August 2021 |
316.10 (-5.23%) |
340.00 |
305.00 - 350.20 |
1.8372 times |

Monthly price and charts BorosilRenewables Strong monthly Stock price targets for BorosilRenewables BORORENEW_BE are 502.8 and 530.2 | Monthly Target 1 | 480.6 | | Monthly Target 2 | 497.6 | | Monthly Target 3 | 508 | | Monthly Target 4 | 525 | | Monthly Target 5 | 535.4 |
Monthly price and volumes Borosil Renewables
| Date |
Closing |
Open |
Range |
Volume |
Tue 04 February 2025 |
514.60 (-2.59%) |
505.00 |
491.00 - 518.40 |
0.0921 times |
Fri 31 January 2025 |
528.30 (-5.74%) |
560.00 |
467.90 - 611.95 |
2.0733 times |
Tue 31 December 2024 |
560.45 (81.7%) |
542.00 |
529.60 - 569.00 |
0.0975 times |
Thu 09 September 2021 |
308.45 (4.63%) |
295.00 |
289.00 - 308.45 |
0.3636 times |
Tue 31 August 2021 |
294.80 (-6.32%) |
320.00 |
276.00 - 350.20 |
1.9724 times |
Fri 30 July 2021 |
314.70 (17.62%) |
267.55 |
261.20 - 333.00 |
2.1692 times |
Wed 30 June 2021 |
267.55 (597.65%) |
286.20 |
252.00 - 293.00 |
1.0938 times |
Fri 20 March 2020 |
38.35 (0%) |
47.50 |
38.35 - 54.90 |
0.1381 times |
Wed 05 February 2025 |
(0%) |
|
- |
0 times |

DMA SMA EMA moving averages of Borosil Renewables BORORENEW_BE
DMA (daily moving average) of Borosil Renewables BORORENEW_BE
| DMA period | DMA value | | 5 day DMA | 510.01 | | 12 day DMA | 520.3 | | 20 day DMA | 543.77 | | 35 day DMA | 480.92 | | 50 day DMA | 429.42 | | 100 day DMA | | | 150 day DMA | | | 200 day DMA | | EMA (exponential moving average) of Borosil Renewables BORORENEW_BE
| EMA period | EMA current | EMA prev | EMA prev2 | | 5 day EMA | 510.3 | 508.15 | 515.23 | | 12 day EMA | 517.52 | 518.05 | 522.42 | | 20 day EMA | 511.96 | 511.68 | 513.54 | | 35 day EMA | 474.53 | 472.17 | 470.89 | | 50 day EMA | 427.78 | 424.24 | 421.39 |
SMA (simple moving average) of Borosil Renewables BORORENEW_BE
| SMA period | SMA current | SMA prev | SMA prev2 | | 5 day SMA | 510.01 | 504 | 503.7 | | 12 day SMA | 520.3 | 525.23 | 533.34 | | 20 day SMA | 543.77 | 545.4 | 546.75 | | 35 day SMA | 480.92 | 474.82 | 469.35 | | 50 day SMA | 429.42 | 425.48 | 421.65 | | 100 day SMA | | 150 day SMA | | 200 day SMA |
|
|
