BinaniIndustries BINANIIND full analysis,charts,indicators,moving averages,SMA,DMA,EMA,ADX,MACD,RSIBinani Industries BINANIIND WideScreen charts, DMA,SMA,EMA technical analysis, forecast prediction, by indicators ADX,MACD,RSI,CCI NSE stock exchange
operates under Holding Companies sector
Daily price and charts and targets BinaniIndustries Strong Daily Stock price targets for BinaniIndustries BINANIIND are 11.61 and 13.66 | Daily Target 1 | 11.2 | | Daily Target 2 | 12.02 | | Daily Target 3 | 13.253333333333 | | Daily Target 4 | 14.07 | | Daily Target 5 | 15.3 |
Daily price and volume Binani Industries
| Date |
Closing |
Open |
Range |
Volume |
Mon 10 February 2025 |
12.83 (-7.23%) |
14.11 |
12.44 - 14.49 |
2.2716 times |
Fri 07 February 2025 |
13.83 (-2.54%) |
14.26 |
13.73 - 14.89 |
0.8521 times |
Thu 06 February 2025 |
14.19 (3.43%) |
14.87 |
13.51 - 14.88 |
0.4047 times |
Wed 05 February 2025 |
13.72 (-3.31%) |
14.47 |
13.69 - 14.47 |
0.5841 times |
Tue 04 February 2025 |
14.19 (2.31%) |
14.45 |
13.39 - 14.45 |
0.8963 times |
Mon 03 February 2025 |
13.87 (5.64%) |
14.05 |
13.16 - 14.05 |
0.7508 times |
Fri 31 January 2025 |
13.13 (2.26%) |
13.35 |
12.57 - 13.35 |
0.4586 times |
Thu 30 January 2025 |
12.84 (0.63%) |
13.09 |
12.55 - 13.11 |
0.4244 times |
Wed 29 January 2025 |
12.76 (0.79%) |
12.89 |
12.02 - 12.89 |
2.4011 times |
Tue 28 January 2025 |
12.66 (-2.31%) |
12.96 |
12.31 - 12.96 |
0.9563 times |
Mon 27 January 2025 |
12.96 (-5.05%) |
13.67 |
12.96 - 13.67 |
1.0246 times |
Weekly price and charts BinaniIndustries Strong weekly Stock price targets for BinaniIndustries BINANIIND are 11.61 and 13.66 | Weekly Target 1 | 11.2 | | Weekly Target 2 | 12.02 | | Weekly Target 3 | 13.253333333333 | | Weekly Target 4 | 14.07 | | Weekly Target 5 | 15.3 |
Weekly price and volumes for Binani Industries
| Date |
Closing |
Open |
Range |
Volume |
Mon 10 February 2025 |
12.83 (-7.23%) |
14.11 |
12.44 - 14.49 |
0.1511 times |
Fri 07 February 2025 |
13.83 (5.33%) |
14.05 |
13.16 - 14.89 |
0.232 times |
Fri 31 January 2025 |
13.13 (-3.81%) |
13.67 |
12.02 - 13.67 |
0.3503 times |
Fri 24 January 2025 |
13.65 (3.49%) |
13.80 |
13.09 - 14.65 |
0.287 times |
Fri 17 January 2025 |
13.19 (-1.57%) |
13.20 |
12.09 - 13.36 |
0.6285 times |
Fri 10 January 2025 |
13.40 (-10.67%) |
15.15 |
13.32 - 15.28 |
0.2826 times |
Fri 03 January 2025 |
15.00 (-30.62%) |
15.20 |
14.26 - 15.74 |
0.2316 times |
Wed 18 September 2024 |
21.62 (13.61%) |
19.98 |
19.92 - 22.00 |
4.2041 times |
Fri 13 September 2024 |
19.03 (30.34%) |
15.06 |
14.47 - 19.03 |
3.3459 times |
Fri 06 September 2024 |
14.60 (-2.34%) |
15.10 |
14.40 - 15.21 |
0.2867 times |
Fri 30 August 2024 |
14.95 (-2.67%) |
15.94 |
14.75 - 15.94 |
0.5191 times |

Monthly price and charts BinaniIndustries Strong monthly Stock price targets for BinaniIndustries BINANIIND are 11.41 and 13.86 | Monthly Target 1 | 10.94 | | Monthly Target 2 | 11.88 | | Monthly Target 3 | 13.386666666667 | | Monthly Target 4 | 14.33 | | Monthly Target 5 | 15.84 |
Monthly price and volumes Binani Industries
| Date |
Closing |
Open |
Range |
Volume |
Mon 10 February 2025 |
12.83 (-2.28%) |
14.05 |
12.44 - 14.89 |
0.1645 times |
Fri 31 January 2025 |
13.13 (-13.05%) |
15.40 |
12.02 - 15.74 |
0.7367 times |
Tue 31 December 2024 |
15.10 (-30.16%) |
15.20 |
14.51 - 15.30 |
0.0278 times |
Wed 18 September 2024 |
21.62 (44.62%) |
15.10 |
14.40 - 22.00 |
3.3655 times |
Fri 30 August 2024 |
14.95 (-7.03%) |
16.75 |
14.75 - 17.19 |
1.1251 times |
Wed 31 July 2024 |
16.08 (-5.13%) |
16.16 |
14.90 - 16.44 |
0.4523 times |
Wed 29 May 2024 |
16.95 (4.63%) |
16.25 |
14.50 - 20.80 |
0.9876 times |
Tue 30 April 2024 |
16.20 (-26.03%) |
14.90 |
14.30 - 17.00 |
0.3101 times |
Tue 06 June 2023 |
21.90 (-0.23%) |
22.40 |
21.05 - 22.75 |
0.1624 times |
Wed 31 May 2023 |
21.95 (3.05%) |
21.80 |
19.45 - 25.20 |
2.6681 times |
Fri 28 April 2023 |
21.30 (-23.1%) |
26.35 |
17.10 - 28.90 |
6.0642 times |

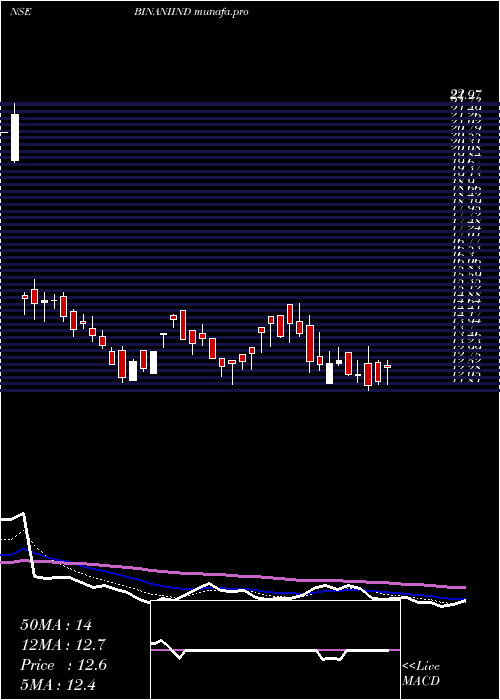
DMA SMA EMA moving averages of Binani Industries BINANIIND
DMA (daily moving average) of Binani Industries BINANIIND
| DMA period | DMA value | | 5 day DMA | 13.75 | | 12 day DMA | 13.39 | | 20 day DMA | 13.34 | | 35 day DMA | 14.52 | | 50 day DMA | 14.66 | | 100 day DMA | 15.36 | | 150 day DMA | 17.98 | | 200 day DMA | 21.45 | EMA (exponential moving average) of Binani Industries BINANIIND
| EMA period | EMA current | EMA prev | EMA prev2 | | 5 day EMA | 13.49 | 13.82 | 13.82 | | 12 day EMA | 13.53 | 13.66 | 13.63 | | 20 day EMA | 13.67 | 13.76 | 13.75 | | 35 day EMA | 14.07 | 14.14 | 14.16 | | 50 day EMA | 14.62 | 14.69 | 14.73 |
SMA (simple moving average) of Binani Industries BINANIIND
| SMA period | SMA current | SMA prev | SMA prev2 | | 5 day SMA | 13.75 | 13.96 | 13.82 | | 12 day SMA | 13.39 | 13.44 | 13.42 | | 20 day SMA | 13.34 | 13.34 | 13.32 | | 35 day SMA | 14.52 | 14.61 | 14.65 | | 50 day SMA | 14.66 | 14.7 | 14.72 | | 100 day SMA | 15.36 | 15.38 | 15.46 | | 150 day SMA | 17.98 | 18.1 | 18.2 | | 200 day SMA | 21.45 | 21.64 | 21.85 |
|
|
