BewEngineering BEWLTD_ST full analysis,charts,indicators,moving averages,SMA,DMA,EMA,ADX,MACD,RSIBew Engineering BEWLTD_ST WideScreen charts, DMA,SMA,EMA technical analysis, forecast prediction, by indicators ADX,MACD,RSI,CCI NSE stock exchange
Daily price and charts and targets BewEngineering Strong Daily Stock price targets for BewEngineering BEWLTD_ST are 168.25 and 170.55 | Daily Target 1 | 166.53 | | Daily Target 2 | 167.67 | | Daily Target 3 | 168.83333333333 | | Daily Target 4 | 169.97 | | Daily Target 5 | 171.13 |
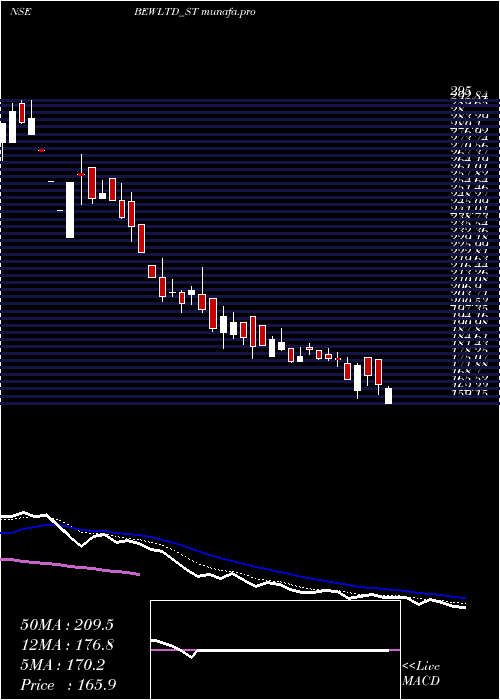
Daily price and volume Bew Engineering
| Date |
Closing |
Open |
Range |
Volume |
Thu 03 July 2025 |
168.80 (0.18%) |
167.70 |
167.70 - 170.00 |
0.6299 times |
Wed 02 July 2025 |
168.50 (-1.23%) |
170.50 |
168.50 - 170.60 |
0.8268 times |
Tue 01 July 2025 |
170.60 (-1.33%) |
173.70 |
170.00 - 174.30 |
0.5512 times |
Mon 30 June 2025 |
172.90 (1.77%) |
170.00 |
168.00 - 174.00 |
1.7717 times |
Fri 27 June 2025 |
169.90 (1.13%) |
169.00 |
167.65 - 171.00 |
1.4567 times |
Thu 26 June 2025 |
168.00 (-0.83%) |
172.85 |
166.00 - 175.00 |
1.3386 times |
Wed 25 June 2025 |
169.40 (0.56%) |
168.95 |
167.00 - 170.00 |
1.6142 times |
Tue 24 June 2025 |
168.45 (-0.65%) |
170.00 |
165.20 - 170.45 |
1.1024 times |
Mon 23 June 2025 |
169.55 (0.09%) |
168.60 |
168.60 - 170.00 |
0.3937 times |
Fri 20 June 2025 |
169.40 (3.1%) |
167.40 |
163.00 - 169.65 |
0.315 times |
Thu 19 June 2025 |
164.30 (-3.97%) |
177.35 |
163.00 - 177.35 |
1.0236 times |
Weekly price and charts BewEngineering Strong weekly Stock price targets for BewEngineering BEWLTD_ST are 164.95 and 171.55 | Weekly Target 1 | 163.67 | | Weekly Target 2 | 166.23 | | Weekly Target 3 | 170.26666666667 | | Weekly Target 4 | 172.83 | | Weekly Target 5 | 176.87 |
Weekly price and volumes for Bew Engineering
| Date |
Closing |
Open |
Range |
Volume |
Thu 03 July 2025 |
168.80 (-0.65%) |
170.00 |
167.70 - 174.30 |
0.4029 times |
Fri 27 June 2025 |
169.90 (0.3%) |
168.60 |
165.20 - 175.00 |
0.6295 times |
Fri 20 June 2025 |
169.40 (1.83%) |
161.15 |
159.05 - 183.90 |
0.7428 times |
Fri 13 June 2025 |
166.35 (-8.02%) |
188.10 |
163.20 - 189.75 |
0.9484 times |
Fri 06 June 2025 |
180.85 (7.52%) |
170.00 |
158.20 - 181.75 |
1.1288 times |
Fri 30 May 2025 |
168.20 (-8.11%) |
173.90 |
153.00 - 174.00 |
2.0562 times |
Fri 23 May 2025 |
183.05 (21.83%) |
193.25 |
183.05 - 202.10 |
0.7092 times |
Fri 07 March 2025 |
150.25 (-4.3%) |
152.00 |
147.05 - 164.85 |
2.1821 times |
Fri 28 February 2025 |
157.00 (-7.1%) |
169.00 |
156.00 - 171.00 |
0.6253 times |
Fri 21 February 2025 |
169.00 (0.99%) |
159.15 |
159.15 - 177.85 |
0.5749 times |
Fri 14 February 2025 |
167.35 (-6.51%) |
179.00 |
161.35 - 181.80 |
1.0701 times |

Monthly price and charts BewEngineering Strong monthly Stock price targets for BewEngineering BEWLTD_ST are 164.95 and 171.55 | Monthly Target 1 | 163.67 | | Monthly Target 2 | 166.23 | | Monthly Target 3 | 170.26666666667 | | Monthly Target 4 | 172.83 | | Monthly Target 5 | 176.87 |
Monthly price and volumes Bew Engineering
| Date |
Closing |
Open |
Range |
Volume |
Thu 03 July 2025 |
168.80 (-2.37%) |
173.70 |
167.70 - 174.30 |
0.0784 times |
Mon 30 June 2025 |
172.90 (2.79%) |
170.00 |
158.20 - 189.75 |
1.3336 times |
Fri 30 May 2025 |
168.20 (11.95%) |
193.25 |
153.00 - 202.10 |
1.0137 times |
Fri 07 March 2025 |
150.25 (-4.3%) |
152.00 |
147.05 - 164.85 |
0.7998 times |
Fri 28 February 2025 |
157.00 (-15.82%) |
183.90 |
156.00 - 185.75 |
0.9552 times |
Fri 31 January 2025 |
186.50 (-27.96%) |
245.95 |
179.35 - 271.10 |
2.2334 times |
Tue 31 December 2024 |
258.90 (24.8%) |
262.60 |
258.90 - 295.00 |
0.9521 times |
Wed 29 September 2021 |
207.45 (0%) |
127.60 |
127.60 - 207.45 |
0.6337 times |
Thu 03 July 2025 |
(0%) |
|
- |
0 times |

DMA SMA EMA moving averages of Bew Engineering BEWLTD_ST
DMA (daily moving average) of Bew Engineering BEWLTD_ST
| DMA period | DMA value | | 5 day DMA | 170.14 | | 12 day DMA | 169.24 | | 20 day DMA | 172.33 | | 35 day DMA | 173.02 | | 50 day DMA | 169.98 | | 100 day DMA | 200.77 | | 150 day DMA | | | 200 day DMA | | EMA (exponential moving average) of Bew Engineering BEWLTD_ST
| EMA period | EMA current | EMA prev | EMA prev2 | | 5 day EMA | 169.5 | 169.85 | 170.52 | | 12 day EMA | 170.07 | 170.3 | 170.63 | | 20 day EMA | 170.62 | 170.81 | 171.05 | | 35 day EMA | 170.75 | 170.86 | 171 | | 50 day EMA | 170.52 | 170.59 | 170.68 |
SMA (simple moving average) of Bew Engineering BEWLTD_ST
| SMA period | SMA current | SMA prev | SMA prev2 | | 5 day SMA | 170.14 | 169.98 | 170.16 | | 12 day SMA | 169.24 | 170.01 | 170.52 | | 20 day SMA | 172.33 | 172.55 | 172.37 | | 35 day SMA | 173.02 | 172.53 | 172.28 | | 50 day SMA | 169.98 | 170.12 | 170.15 | | 100 day SMA | 200.77 | 200.97 | 201.07 | | 150 day SMA | | 200 day SMA |
|
|
