AlbertDavid ALBERTDAVD_BE full analysis,charts,indicators,moving averages,SMA,DMA,EMA,ADX,MACD,RSIAlbert David ALBERTDAVD_BE WideScreen charts, DMA,SMA,EMA technical analysis, forecast prediction, by indicators ADX,MACD,RSI,CCI NSE stock exchange
Daily price and charts and targets AlbertDavid Strong Daily Stock price targets for AlbertDavid ALBERTDAVD_BE are 1338.05 and 1396.05 | Daily Target 1 | 1326.03 | | Daily Target 2 | 1350.07 | | Daily Target 3 | 1384.0333333333 | | Daily Target 4 | 1408.07 | | Daily Target 5 | 1442.03 |
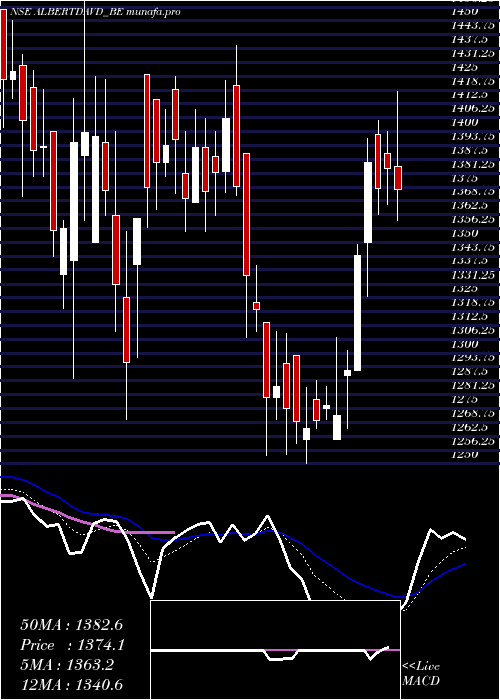
Daily price and volume Albert David
| Date |
Closing |
Open |
Range |
Volume |
Fri 06 December 2024 |
1374.10 (-0.68%) |
1384.25 |
1360.00 - 1418.00 |
1.3036 times |
Thu 05 December 2024 |
1383.45 (0.65%) |
1389.95 |
1367.00 - 1400.00 |
0.5666 times |
Wed 04 December 2024 |
1374.45 (-0.84%) |
1398.80 |
1362.75 - 1405.00 |
0.6683 times |
Tue 03 December 2024 |
1386.10 (3.11%) |
1350.00 |
1325.50 - 1397.00 |
1.2945 times |
Mon 02 December 2024 |
1344.30 (4.03%) |
1292.20 |
1292.00 - 1349.00 |
1.2264 times |
Fri 29 November 2024 |
1292.20 (1.6%) |
1290.00 |
1266.00 - 1301.00 |
0.8318 times |
Thu 28 November 2024 |
1271.80 (-0.34%) |
1261.20 |
1261.20 - 1307.00 |
1.3573 times |
Wed 27 November 2024 |
1276.15 (0.53%) |
1274.90 |
1270.00 - 1284.90 |
0.9885 times |
Tue 26 November 2024 |
1269.45 (0.28%) |
1279.00 |
1266.00 - 1287.80 |
0.6247 times |
Mon 25 November 2024 |
1265.95 (-0.24%) |
1261.10 |
1250.00 - 1284.45 |
1.1383 times |
Fri 22 November 2024 |
1268.95 (-0.45%) |
1298.90 |
1259.00 - 1298.90 |
0.6512 times |
Weekly price and charts AlbertDavid Strong weekly Stock price targets for AlbertDavid ALBERTDAVD_BE are 1333.05 and 1459.05 | Weekly Target 1 | 1235.37 | | Weekly Target 2 | 1304.73 | | Weekly Target 3 | 1361.3666666667 | | Weekly Target 4 | 1430.73 | | Weekly Target 5 | 1487.37 |
Weekly price and volumes for Albert David
| Date |
Closing |
Open |
Range |
Volume |
Fri 06 December 2024 |
1374.10 (6.34%) |
1292.20 |
1292.00 - 1418.00 |
1.0147 times |
Fri 29 November 2024 |
1292.20 (1.83%) |
1261.10 |
1250.00 - 1307.00 |
0.9908 times |
Fri 22 November 2024 |
1268.95 (-3.86%) |
1314.00 |
1253.90 - 1314.00 |
0.5994 times |
Thu 14 November 2024 |
1319.90 (-4.48%) |
1382.00 |
1307.05 - 1438.80 |
0.8003 times |
Fri 08 November 2024 |
1381.75 (-0.85%) |
1418.95 |
1355.00 - 1425.00 |
0.7949 times |
Fri 01 November 2024 |
1393.60 (4.72%) |
1325.00 |
1270.00 - 1425.60 |
0.7626 times |
Fri 25 October 2024 |
1330.80 (-1.88%) |
1342.00 |
1288.55 - 1464.95 |
2.0595 times |
Fri 18 October 2024 |
1356.35 (-4.96%) |
1430.00 |
1320.00 - 1435.00 |
0.9356 times |
Fri 11 October 2024 |
1427.20 (-3.27%) |
1475.50 |
1365.10 - 1495.00 |
1.0492 times |
Fri 04 October 2024 |
1475.50 (0.61%) |
1444.00 |
1416.05 - 1509.90 |
0.9929 times |
Fri 27 September 2024 |
1466.50 (-1.81%) |
1508.95 |
1421.10 - 1524.00 |
1.322 times |

Monthly price and charts AlbertDavid Strong monthly Stock price targets for AlbertDavid ALBERTDAVD_BE are 1333.05 and 1459.05 | Monthly Target 1 | 1235.37 | | Monthly Target 2 | 1304.73 | | Monthly Target 3 | 1361.3666666667 | | Monthly Target 4 | 1430.73 | | Monthly Target 5 | 1487.37 |
Monthly price and volumes Albert David
| Date |
Closing |
Open |
Range |
Volume |
Fri 06 December 2024 |
1374.10 (6.34%) |
1292.20 |
1292.00 - 1418.00 |
0.2694 times |
Fri 29 November 2024 |
1292.20 (-6.77%) |
1386.05 |
1250.00 - 1438.80 |
0.8685 times |
Thu 31 October 2024 |
1386.05 (-4.81%) |
1456.10 |
1270.00 - 1509.90 |
1.4821 times |
Mon 30 September 2024 |
1456.10 (0%) |
1615.10 |
1411.00 - 1659.00 |
1.38 times |
Mon 03 February 2025 |
(0%) |
|
- |
0 times |

DMA SMA EMA moving averages of Albert David ALBERTDAVD_BE
DMA (daily moving average) of Albert David ALBERTDAVD_BE
| DMA period | DMA value | | 5 day DMA | 1372.48 | | 12 day DMA | 1315.14 | | 20 day DMA | 1326.88 | | 35 day DMA | 1346.18 | | 50 day DMA | 1373.93 | | 100 day DMA | | | 150 day DMA | | | 200 day DMA | | EMA (exponential moving average) of Albert David ALBERTDAVD_BE
| EMA period | EMA current | EMA prev | EMA prev2 | | 5 day EMA | 1363.19 | 1357.74 | 1344.89 | | 12 day EMA | 1340.59 | 1334.5 | 1325.6 | | 20 day EMA | 1339.58 | 1335.95 | 1330.95 | | 35 day EMA | 1356.03 | 1354.97 | 1353.29 | | 50 day EMA | 1382.37 | 1382.71 | 1382.68 |
SMA (simple moving average) of Albert David ALBERTDAVD_BE
| SMA period | SMA current | SMA prev | SMA prev2 | | 5 day SMA | 1372.48 | 1356.1 | 1333.77 | | 12 day SMA | 1315.14 | 1307.73 | 1299.11 | | 20 day SMA | 1326.88 | 1327.82 | 1327.13 | | 35 day SMA | 1346.18 | 1346.73 | 1346.95 | | 50 day SMA | 1373.93 | 1375.75 | 1377.9 | | 100 day SMA | | 150 day SMA | | 200 day SMA |
|
|
