AgniGreen AGNI_ST full analysis,charts,indicators,moving averages,SMA,DMA,EMA,ADX,MACD,RSIAgni Green AGNI_ST WideScreen charts, DMA,SMA,EMA technical analysis, forecast prediction, by indicators ADX,MACD,RSI,CCI NSE stock exchange
Daily price and charts and targets AgniGreen Strong Daily Stock price targets for AgniGreen AGNI_ST are 26.15 and 26.55 | Daily Target 1 | 25.83 | | Daily Target 2 | 26.07 | | Daily Target 3 | 26.233333333333 | | Daily Target 4 | 26.47 | | Daily Target 5 | 26.63 |
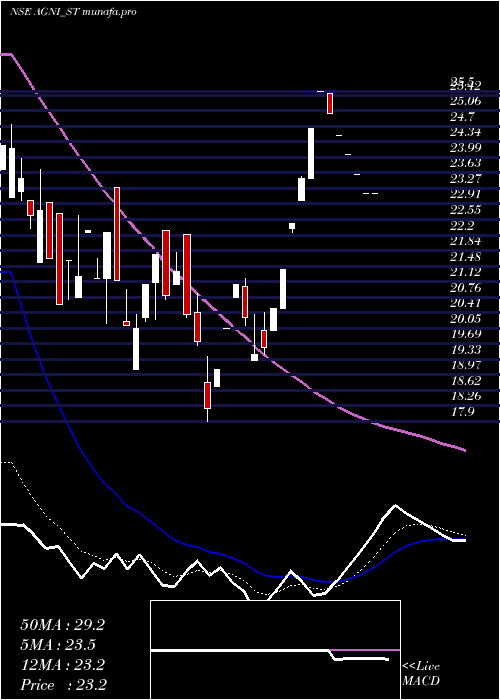
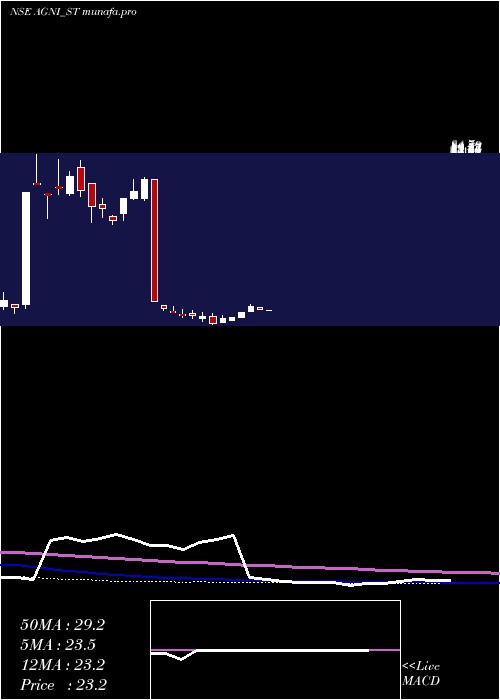
Daily price and volume Agni Green
| Date |
Closing |
Open |
Range |
Volume |
Tue 04 November 2025 |
26.30 (4.37%) |
26.00 |
26.00 - 26.40 |
1.6667 times |
Mon 03 November 2025 |
25.20 (5%) |
24.65 |
24.15 - 25.20 |
1 times |
Fri 31 October 2025 |
24.00 (0.21%) |
23.95 |
23.60 - 24.00 |
0.6667 times |
Thu 30 October 2025 |
23.95 (-1.24%) |
24.00 |
23.85 - 24.45 |
1 times |
Wed 29 October 2025 |
24.25 (1.04%) |
24.00 |
23.25 - 24.25 |
2.1667 times |
Tue 28 October 2025 |
24.00 (-0.41%) |
24.10 |
24.00 - 24.20 |
1.1667 times |
Fri 24 October 2025 |
24.10 (-1.83%) |
24.55 |
24.00 - 24.55 |
1.1667 times |
Thu 23 October 2025 |
24.55 (-2.58%) |
25.20 |
24.55 - 25.20 |
0.5 times |
Fri 17 October 2025 |
25.20 (0%) |
25.25 |
25.20 - 25.25 |
0.3333 times |
Thu 16 October 2025 |
25.20 (-3.08%) |
26.00 |
25.20 - 26.00 |
0.3333 times |
Wed 15 October 2025 |
26.00 (0%) |
26.50 |
25.35 - 26.50 |
0.8333 times |
Weekly price and charts AgniGreen Strong weekly Stock price targets for AgniGreen AGNI_ST are 25.23 and 27.48 | Weekly Target 1 | 23.37 | | Weekly Target 2 | 24.83 | | Weekly Target 3 | 25.616666666667 | | Weekly Target 4 | 27.08 | | Weekly Target 5 | 27.87 |
Weekly price and volumes for Agni Green
| Date |
Closing |
Open |
Range |
Volume |
Tue 04 November 2025 |
26.30 (9.58%) |
24.65 |
24.15 - 26.40 |
0.5316 times |
Fri 31 October 2025 |
24.00 (-0.41%) |
24.10 |
23.25 - 24.45 |
0.9967 times |
Fri 24 October 2025 |
24.10 (-4.37%) |
25.20 |
24.00 - 25.20 |
0.3322 times |
Fri 17 October 2025 |
25.20 (-0.98%) |
25.45 |
25.20 - 26.50 |
0.598 times |
Fri 10 October 2025 |
25.45 (-4.5%) |
27.20 |
25.20 - 27.60 |
1.0631 times |
Fri 03 October 2025 |
26.65 (-2.56%) |
27.30 |
26.20 - 28.00 |
0.897 times |
Fri 26 September 2025 |
27.35 (-8.83%) |
30.00 |
27.35 - 30.00 |
0.6977 times |
Fri 19 September 2025 |
30.00 (1.52%) |
30.35 |
28.00 - 30.50 |
1.3289 times |
Fri 12 September 2025 |
29.55 (-13.72%) |
34.25 |
27.95 - 34.25 |
2.8571 times |
Fri 05 September 2025 |
34.25 (67.07%) |
36.05 |
34.25 - 36.05 |
0.6977 times |
Fri 08 August 2025 |
20.50 (2.5%) |
20.95 |
20.25 - 22.05 |
1.1628 times |
Monthly price and charts AgniGreen Strong monthly Stock price targets for AgniGreen AGNI_ST are 25.23 and 27.48 | Monthly Target 1 | 23.37 | | Monthly Target 2 | 24.83 | | Monthly Target 3 | 25.616666666667 | | Monthly Target 4 | 27.08 | | Monthly Target 5 | 27.87 |
Monthly price and volumes Agni Green
| Date |
Closing |
Open |
Range |
Volume |
Tue 04 November 2025 |
26.30 (9.58%) |
24.65 |
24.15 - 26.40 |
0.1183 times |
Fri 31 October 2025 |
24.00 (-13.98%) |
27.90 |
23.25 - 27.90 |
0.8056 times |
Mon 29 September 2025 |
27.90 (36.1%) |
36.05 |
26.50 - 36.05 |
1.3008 times |
Fri 08 August 2025 |
20.50 (-0.73%) |
20.00 |
20.00 - 22.05 |
0.2956 times |
Thu 31 July 2025 |
20.65 (-25.99%) |
27.90 |
20.65 - 28.45 |
0.8056 times |
Mon 30 June 2025 |
27.90 (17.72%) |
23.80 |
22.55 - 30.10 |
1.7664 times |
Fri 30 May 2025 |
23.70 (-1.46%) |
23.60 |
22.25 - 23.95 |
0.6726 times |
Tue 29 April 2025 |
24.05 (32.14%) |
18.70 |
18.70 - 25.50 |
0.9091 times |
Fri 28 March 2025 |
18.20 (-19.65%) |
21.55 |
17.90 - 23.70 |
2.7125 times |
Fri 28 February 2025 |
22.65 (-69.8%) |
27.40 |
22.35 - 27.40 |
0.6135 times |
Mon 22 April 2024 |
75.00 (27.77%) |
61.60 |
58.65 - 75.95 |
3.0894 times |

DMA SMA EMA moving averages of Agni Green AGNI_ST
DMA (daily moving average) of Agni Green AGNI_ST
| DMA period | DMA value | | 5 day DMA | 24.74 | | 12 day DMA | 24.9 | | 20 day DMA | 25.56 | | 35 day DMA | 27.08 | | 50 day DMA | 26.08 | | 100 day DMA | 25.67 | | 150 day DMA | 26.48 | | 200 day DMA | 36.86 | EMA (exponential moving average) of Agni Green AGNI_ST
| EMA period | EMA current | EMA prev | EMA prev2 | | 5 day EMA | 25.12 | 24.53 | 24.19 | | 12 day EMA | 25.13 | 24.92 | 24.87 | | 20 day EMA | 25.51 | 25.43 | 25.45 | | 35 day EMA | 25.6 | 25.56 | 25.58 | | 50 day EMA | 25.87 | 25.85 | 25.88 |
SMA (simple moving average) of Agni Green AGNI_ST
| SMA period | SMA current | SMA prev | SMA prev2 | | 5 day SMA | 24.74 | 24.28 | 24.06 | | 12 day SMA | 24.9 | 24.87 | 24.89 | | 20 day SMA | 25.56 | 25.64 | 25.75 | | 35 day SMA | 27.08 | 27.26 | 27.52 | | 50 day SMA | 26.08 | 26.04 | 26.03 | | 100 day SMA | 25.67 | 25.64 | 25.63 | | 150 day SMA | 26.48 | 26.8 | 27.1 | | 200 day SMA | 36.86 | 36.85 | 36.84 |
|
|
