AbhaPower ABHAPOWER_ST full analysis,charts,indicators,moving averages,SMA,DMA,EMA,ADX,MACD,RSIAbha Power ABHAPOWER_ST WideScreen charts, DMA,SMA,EMA technical analysis, forecast prediction, by indicators ADX,MACD,RSI,CCI NSE stock exchange
Daily price and charts and targets AbhaPower Strong Daily Stock price targets for AbhaPower ABHAPOWER_ST are 37.08 and 38.68 | Daily Target 1 | 36.55 | | Daily Target 2 | 37.6 | | Daily Target 3 | 38.15 | | Daily Target 4 | 39.2 | | Daily Target 5 | 39.75 |
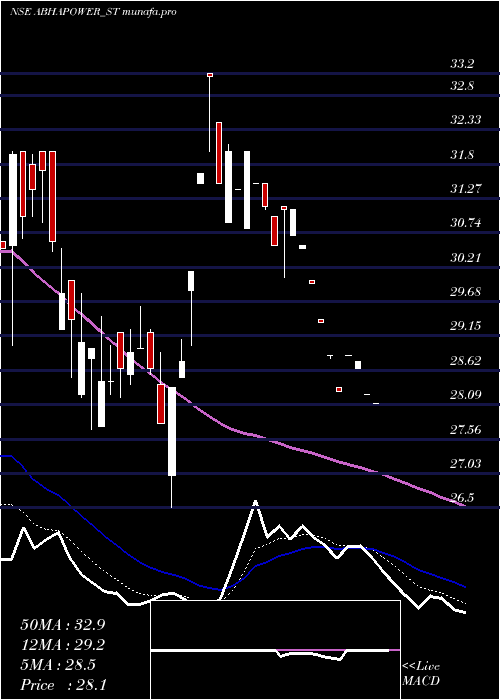
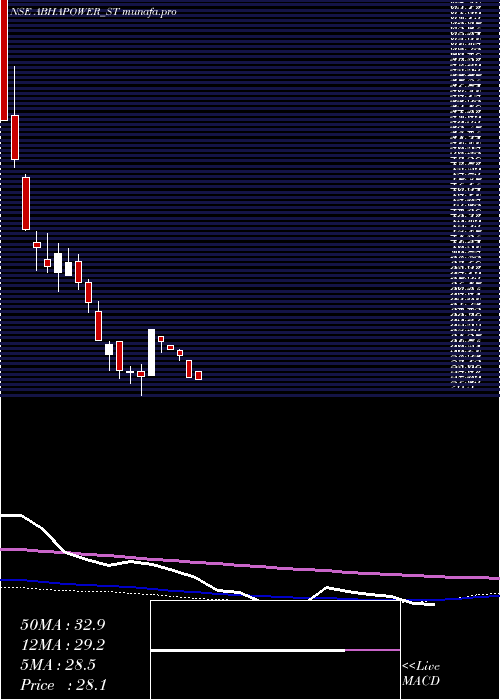
Daily price and volume Abha Power
| Date |
Closing |
Open |
Range |
Volume |
Tue 04 November 2025 |
38.65 (-0.64%) |
38.70 |
37.10 - 38.70 |
2.3256 times |
Mon 03 November 2025 |
38.90 (2.77%) |
38.00 |
38.00 - 39.35 |
2.3256 times |
Fri 31 October 2025 |
37.85 (0.53%) |
37.85 |
37.85 - 37.85 |
0.2326 times |
Thu 30 October 2025 |
37.65 (0.53%) |
38.00 |
37.65 - 38.00 |
0.9302 times |
Wed 29 October 2025 |
37.45 (-1.71%) |
38.10 |
37.45 - 38.10 |
0.4651 times |
Tue 28 October 2025 |
38.10 (-1.93%) |
39.65 |
37.75 - 39.65 |
1.6279 times |
Mon 27 October 2025 |
38.85 (3.46%) |
37.55 |
37.55 - 38.85 |
0.4651 times |
Thu 23 October 2025 |
37.55 (0.27%) |
37.55 |
37.55 - 37.55 |
0.2326 times |
Tue 21 October 2025 |
37.45 (-1.71%) |
37.35 |
37.35 - 37.55 |
0.6977 times |
Mon 20 October 2025 |
38.10 (-1.68%) |
38.75 |
38.10 - 38.75 |
0.6977 times |
Fri 17 October 2025 |
38.75 (-3.13%) |
39.20 |
38.00 - 40.50 |
5.3488 times |
Weekly price and charts AbhaPower Strong weekly Stock price targets for AbhaPower ABHAPOWER_ST are 37.88 and 40.13 | Weekly Target 1 | 36.12 | | Weekly Target 2 | 37.38 | | Weekly Target 3 | 38.366666666667 | | Weekly Target 4 | 39.63 | | Weekly Target 5 | 40.62 |
Weekly price and volumes for Abha Power
| Date |
Closing |
Open |
Range |
Volume |
Tue 04 November 2025 |
38.65 (2.11%) |
38.00 |
37.10 - 39.35 |
0.5731 times |
Fri 31 October 2025 |
37.85 (0.8%) |
37.55 |
37.45 - 39.65 |
0.4585 times |
Thu 23 October 2025 |
37.55 (-3.1%) |
38.75 |
37.35 - 38.75 |
0.2006 times |
Fri 17 October 2025 |
38.75 (-8.93%) |
41.65 |
38.00 - 42.55 |
2.5215 times |
Thu 09 October 2025 |
42.55 (-3.51%) |
45.00 |
42.00 - 46.10 |
1.1461 times |
Fri 03 October 2025 |
44.10 (7.69%) |
40.50 |
40.00 - 44.10 |
0.8596 times |
Fri 26 September 2025 |
40.95 (-2.15%) |
40.00 |
38.10 - 44.20 |
1.4327 times |
Fri 19 September 2025 |
41.85 (-4.12%) |
45.75 |
41.45 - 45.75 |
0.7736 times |
Fri 12 September 2025 |
43.65 (1.63%) |
42.65 |
42.65 - 45.95 |
0.659 times |
Fri 05 September 2025 |
42.95 (-8.62%) |
47.00 |
42.90 - 48.80 |
1.3754 times |
Fri 29 August 2025 |
47.00 (46.88%) |
46.50 |
45.20 - 48.10 |
0.9169 times |
Monthly price and charts AbhaPower Strong monthly Stock price targets for AbhaPower ABHAPOWER_ST are 37.88 and 40.13 | Monthly Target 1 | 36.12 | | Monthly Target 2 | 37.38 | | Monthly Target 3 | 38.366666666667 | | Monthly Target 4 | 39.63 | | Monthly Target 5 | 40.62 |
Monthly price and volumes Abha Power
| Date |
Closing |
Open |
Range |
Volume |
Tue 04 November 2025 |
38.65 (2.11%) |
38.00 |
37.10 - 39.35 |
0.1224 times |
Fri 31 October 2025 |
37.85 (-5.38%) |
40.70 |
37.35 - 46.10 |
1.0832 times |
Tue 30 September 2025 |
40.00 (-14.89%) |
47.00 |
38.10 - 48.80 |
0.9302 times |
Fri 29 August 2025 |
47.00 (46.88%) |
46.50 |
45.20 - 48.10 |
0.1958 times |
Fri 11 July 2025 |
32.00 (10.34%) |
29.90 |
29.15 - 32.50 |
0.3672 times |
Mon 30 June 2025 |
29.00 (-11.31%) |
33.30 |
28.60 - 33.30 |
0.5692 times |
Fri 30 May 2025 |
32.70 (13.34%) |
28.35 |
28.10 - 33.65 |
0.8752 times |
Wed 30 April 2025 |
28.85 (1.76%) |
28.50 |
28.50 - 33.20 |
0.8384 times |
Fri 28 March 2025 |
28.35 (-11.68%) |
30.60 |
26.50 - 32.00 |
3.2375 times |
Fri 28 February 2025 |
32.10 (-21.52%) |
38.65 |
32.10 - 41.45 |
1.7809 times |
Fri 31 January 2025 |
40.90 (-31.78%) |
53.65 |
37.00 - 53.65 |
4.3819 times |

DMA SMA EMA moving averages of Abha Power ABHAPOWER_ST
DMA (daily moving average) of Abha Power ABHAPOWER_ST
| DMA period | DMA value | | 5 day DMA | 38.1 | | 12 day DMA | 38.28 | | 20 day DMA | 40.13 | | 35 day DMA | 41.19 | | 50 day DMA | 41.16 | | 100 day DMA | 35.91 | | 150 day DMA | 35.11 | | 200 day DMA | | EMA (exponential moving average) of Abha Power ABHAPOWER_ST
| EMA period | EMA current | EMA prev | EMA prev2 | | 5 day EMA | 38.38 | 38.25 | 37.92 | | 12 day EMA | 38.78 | 38.8 | 38.78 | | 20 day EMA | 39.37 | 39.45 | 39.51 | | 35 day EMA | 39.69 | 39.75 | 39.8 | | 50 day EMA | 39.97 | 40.02 | 40.07 |
SMA (simple moving average) of Abha Power ABHAPOWER_ST
| SMA period | SMA current | SMA prev | SMA prev2 | | 5 day SMA | 38.1 | 37.99 | 37.98 | | 12 day SMA | 38.28 | 38.41 | 38.63 | | 20 day SMA | 40.13 | 40.29 | 40.35 | | 35 day SMA | 41.19 | 41.4 | 41.55 | | 50 day SMA | 41.16 | 41.01 | 40.86 | | 100 day SMA | 35.91 | 35.83 | 35.75 | | 150 day SMA | 35.11 | 35.11 | 35.11 | | 200 day SMA |
|
|
