Abanfshore ABAN full analysis,charts,indicators,moving averages,SMA,DMA,EMA,ADX,MACD,RSIAbanfshore ABAN WideScreen charts, DMA,SMA,EMA technical analysis, forecast prediction, by indicators ADX,MACD,RSI,CCI NSE stock exchange
operates under Exploration & Production sector
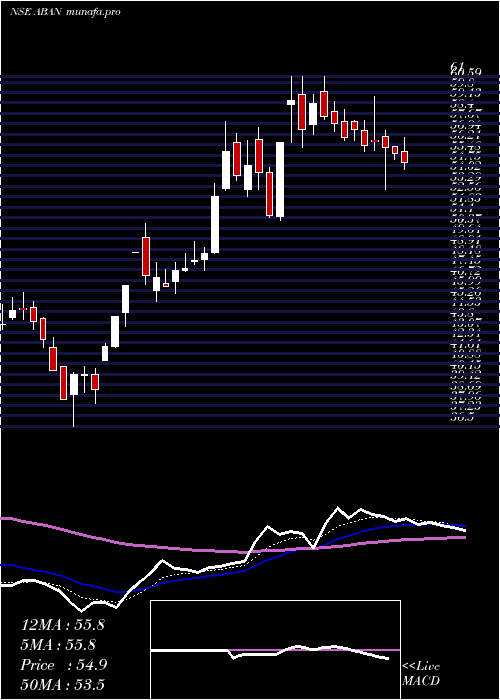
Daily price and charts and targets Abanfshore Strong Daily Stock price targets for Abanfshore ABAN are 45.41 and 47.96 | Daily Target 1 | 44.87 | | Daily Target 2 | 45.94 | | Daily Target 3 | 47.42 | | Daily Target 4 | 48.49 | | Daily Target 5 | 49.97 |
Daily price and volume Abanfshore
| Date |
Closing |
Open |
Range |
Volume |
Fri 29 August 2025 |
47.01 (-0.74%) |
47.60 |
46.35 - 48.90 |
0.2013 times |
Thu 28 August 2025 |
47.36 (-1.17%) |
47.92 |
47.11 - 49.14 |
0.4056 times |
Tue 26 August 2025 |
47.92 (-3.33%) |
48.95 |
47.65 - 49.43 |
0.3623 times |
Mon 25 August 2025 |
49.57 (0.04%) |
51.99 |
49.00 - 52.14 |
1.5398 times |
Fri 22 August 2025 |
49.55 (8.97%) |
46.10 |
45.70 - 50.01 |
3.3984 times |
Thu 21 August 2025 |
45.47 (-3.91%) |
46.80 |
45.30 - 47.69 |
1.1589 times |
Wed 20 August 2025 |
47.32 (9.23%) |
43.54 |
43.21 - 47.65 |
2.1301 times |
Tue 19 August 2025 |
43.32 (2.24%) |
42.37 |
42.19 - 43.90 |
0.3074 times |
Mon 18 August 2025 |
42.37 (-0.8%) |
43.20 |
42.00 - 44.74 |
0.2389 times |
Thu 14 August 2025 |
42.71 (0.83%) |
42.36 |
41.96 - 43.20 |
0.2572 times |
Wed 13 August 2025 |
42.36 (0.09%) |
42.32 |
42.17 - 44.10 |
0.2103 times |
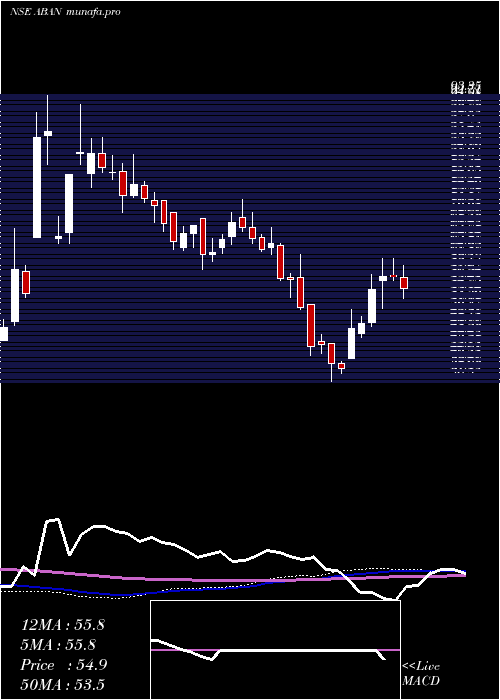
Weekly price and charts Abanfshore Strong weekly Stock price targets for Abanfshore ABAN are 43.79 and 49.58 | Weekly Target 1 | 42.71 | | Weekly Target 2 | 44.86 | | Weekly Target 3 | 48.5 | | Weekly Target 4 | 50.65 | | Weekly Target 5 | 54.29 |
Weekly price and volumes for Abanfshore
| Date |
Closing |
Open |
Range |
Volume |
Fri 29 August 2025 |
47.01 (-5.13%) |
51.99 |
46.35 - 52.14 |
0.8416 times |
Fri 22 August 2025 |
49.55 (16.01%) |
43.20 |
42.00 - 50.01 |
2.4265 times |
Thu 14 August 2025 |
42.71 (-0.86%) |
43.50 |
41.80 - 44.10 |
0.3273 times |
Fri 08 August 2025 |
43.08 (-2.36%) |
44.00 |
42.00 - 44.50 |
0.6307 times |
Fri 01 August 2025 |
44.12 (-9.29%) |
49.80 |
43.40 - 49.85 |
0.8354 times |
Fri 25 July 2025 |
48.64 (-3.34%) |
50.32 |
47.95 - 52.90 |
0.7801 times |
Fri 18 July 2025 |
50.32 (-4.95%) |
53.74 |
49.52 - 53.74 |
0.7193 times |
Fri 11 July 2025 |
52.94 (-3.64%) |
55.28 |
51.96 - 55.28 |
0.7223 times |
Fri 04 July 2025 |
54.94 (-4.05%) |
57.19 |
53.06 - 59.59 |
1.2312 times |
Fri 27 June 2025 |
57.26 (-0.05%) |
57.59 |
56.50 - 61.00 |
1.4855 times |
Fri 20 June 2025 |
57.29 (4.66%) |
56.57 |
50.90 - 61.00 |
5.4136 times |
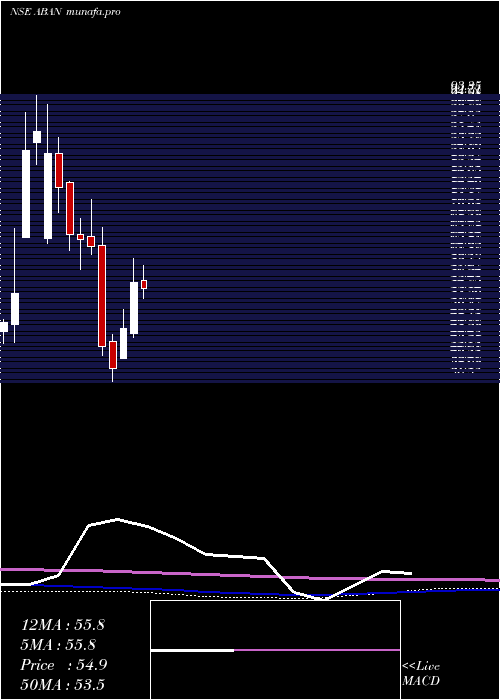
Monthly price and charts Abanfshore Strong monthly Stock price targets for Abanfshore ABAN are 44.41 and 54.75 | Monthly Target 1 | 36.64 | | Monthly Target 2 | 41.83 | | Monthly Target 3 | 46.983333333333 | | Monthly Target 4 | 52.17 | | Monthly Target 5 | 57.32 |
Monthly price and volumes Abanfshore
| Date |
Closing |
Open |
Range |
Volume |
Fri 29 August 2025 |
47.01 (4.4%) |
45.03 |
41.80 - 52.14 |
0.9845 times |
Thu 31 July 2025 |
45.03 (-19.76%) |
56.50 |
43.40 - 59.59 |
0.8921 times |
Mon 30 June 2025 |
56.12 (19.2%) |
46.01 |
45.27 - 61.00 |
2.5483 times |
Fri 30 May 2025 |
47.08 (20.53%) |
41.08 |
41.08 - 50.70 |
0.2977 times |
Mon 17 February 2025 |
39.06 (-10.17%) |
44.50 |
36.50 - 45.84 |
0.6184 times |
Fri 31 January 2025 |
43.48 (-31.4%) |
63.50 |
41.55 - 67.04 |
0.986 times |
Tue 31 December 2024 |
63.38 (-2.15%) |
65.39 |
61.65 - 72.70 |
0.8461 times |
Fri 29 November 2024 |
64.77 (-1.46%) |
65.73 |
58.76 - 68.80 |
0.5999 times |
Thu 31 October 2024 |
65.73 (-12.45%) |
76.00 |
62.56 - 76.23 |
0.7941 times |
Mon 30 September 2024 |
75.08 (-8.3%) |
81.76 |
70.06 - 85.10 |
1.433 times |
Fri 30 August 2024 |
81.88 (-5.01%) |
65.00 |
63.90 - 91.50 |
4.1195 times |
DMA SMA EMA moving averages of Abanfshore ABAN
DMA (daily moving average) of Abanfshore ABAN
| DMA period | DMA value | | 5 day DMA | 48.28 | | 12 day DMA | 45.61 | | 20 day DMA | 44.75 | | 35 day DMA | 47 | | 50 day DMA | 49.83 | | 100 day DMA | 49.87 | | 150 day DMA | 54.85 | | 200 day DMA | 60.09 | EMA (exponential moving average) of Abanfshore ABAN
| EMA period | EMA current | EMA prev | EMA prev2 | | 5 day EMA | 47.34 | 47.5 | 47.57 | | 12 day EMA | 46.46 | 46.36 | 46.18 | | 20 day EMA | 46.42 | 46.36 | 46.25 | | 35 day EMA | 47.88 | 47.93 | 47.96 | | 50 day EMA | 50.03 | 50.15 | 50.26 |
SMA (simple moving average) of Abanfshore ABAN
| SMA period | SMA current | SMA prev | SMA prev2 | | 5 day SMA | 48.28 | 47.97 | 47.97 | | 12 day SMA | 45.61 | 45.2 | 44.84 | | 20 day SMA | 44.75 | 44.63 | 44.61 | | 35 day SMA | 47 | 47.18 | 47.38 | | 50 day SMA | 49.83 | 50.02 | 50.1 | | 100 day SMA | 49.87 | 50.03 | 50.19 | | 150 day SMA | 54.85 | 54.98 | 55.12 | | 200 day SMA | 60.09 | 60.18 | 60.27 |
|
|
