GoiTbill 91D300125_TB full analysis,charts,indicators,moving averages,SMA,DMA,EMA,ADX,MACD,RSIGoi Tbill 91D300125_TB WideScreen charts, DMA,SMA,EMA technical analysis, forecast prediction, by indicators ADX,MACD,RSI,CCI NSE stock exchange
Daily price and charts and targets GoiTbill Strong Daily Stock price targets for GoiTbill 91D300125_TB are 99.86 and 99.86 | Daily Target 1 | 99.86 | | Daily Target 2 | 99.86 | | Daily Target 3 | 99.86 | | Daily Target 4 | 99.86 | | Daily Target 5 | 99.86 |
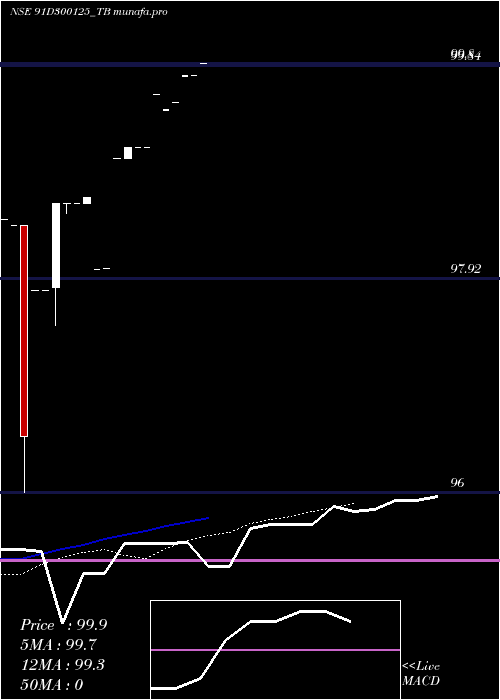
Daily price and volume Goi Tbill
| Date |
Closing |
Open |
Range |
Volume |
Mon 27 January 2025 |
99.86 (0.11%) |
99.86 |
99.86 - 99.86 |
0.2326 times |
Fri 24 January 2025 |
99.75 (0%) |
99.75 |
99.75 - 99.75 |
0.2326 times |
Wed 22 January 2025 |
99.75 (0.24%) |
99.74 |
99.74 - 99.75 |
0.4651 times |
Wed 15 January 2025 |
99.51 (0.06%) |
99.51 |
99.51 - 99.51 |
0.2326 times |
Tue 14 January 2025 |
99.45 (-0.12%) |
99.44 |
99.44 - 99.45 |
0.4651 times |
Mon 13 January 2025 |
99.57 (0.47%) |
99.57 |
99.57 - 99.57 |
0.6977 times |
Thu 26 December 2024 |
99.10 (0%) |
99.10 |
99.10 - 99.10 |
0.2326 times |
Tue 24 December 2024 |
99.10 (0%) |
99.10 |
99.10 - 99.10 |
0.2326 times |
Mon 23 December 2024 |
99.10 (0.1%) |
99.00 |
99.00 - 99.10 |
2.5581 times |
Fri 20 December 2024 |
99.00 (1.01%) |
99.00 |
99.00 - 99.00 |
4.6512 times |
Wed 11 December 2024 |
98.01 (0.01%) |
98.01 |
98.01 - 98.01 |
0.4651 times |
Weekly price and charts GoiTbill Strong weekly Stock price targets for GoiTbill 91D300125_TB are 99.86 and 99.86 | Weekly Target 1 | 99.86 | | Weekly Target 2 | 99.86 | | Weekly Target 3 | 99.86 | | Weekly Target 4 | 99.86 | | Weekly Target 5 | 99.86 |
Weekly price and volumes for Goi Tbill
| Date |
Closing |
Open |
Range |
Volume |
Mon 27 January 2025 |
99.86 (0.11%) |
99.86 |
99.86 - 99.86 |
0.0598 times |
Fri 24 January 2025 |
99.75 (0.24%) |
99.74 |
99.74 - 99.75 |
0.1795 times |
Wed 15 January 2025 |
99.51 (0.41%) |
99.57 |
99.44 - 99.57 |
0.359 times |
Thu 26 December 2024 |
99.10 (0.1%) |
99.00 |
99.00 - 99.10 |
0.7778 times |
Fri 20 December 2024 |
99.00 (0.35%) |
98.00 |
98.00 - 99.00 |
1.4359 times |
Wed 27 November 2024 |
98.65 (0.05%) |
98.60 |
98.60 - 98.65 |
2.3333 times |
Fri 22 November 2024 |
98.60 (0%) |
97.82 |
97.50 - 98.60 |
1.8547 times |
Mon 03 February 2025 |
(0%) |
|
- |
0 times |

Monthly price and charts GoiTbill Strong monthly Stock price targets for GoiTbill 91D300125_TB are 99.65 and 100.07 | Monthly Target 1 | 99.3 | | Monthly Target 2 | 99.58 | | Monthly Target 3 | 99.72 | | Monthly Target 4 | 100 | | Monthly Target 5 | 100.14 |
Monthly price and volumes Goi Tbill
| Date |
Closing |
Open |
Range |
Volume |
Mon 27 January 2025 |
99.86 (0.77%) |
99.57 |
99.44 - 99.86 |
0.0421 times |
Thu 26 December 2024 |
99.10 (0.46%) |
98.00 |
98.00 - 99.10 |
0.1557 times |
Wed 27 November 2024 |
98.65 (0%) |
98.45 |
96.00 - 98.65 |
2.8022 times |
Mon 03 February 2025 |
(0%) |
|
- |
0 times |

DMA SMA EMA moving averages of Goi Tbill 91D300125_TB
DMA (daily moving average) of Goi Tbill 91D300125_TB
| DMA period | DMA value | | 5 day DMA | 99.66 | | 12 day DMA | 99.18 | | 20 day DMA | | | 35 day DMA | | | 50 day DMA | | | 100 day DMA | | | 150 day DMA | | | 200 day DMA | | EMA (exponential moving average) of Goi Tbill 91D300125_TB
| EMA period | EMA current | EMA prev | EMA prev2 | | 5 day EMA | 99.66 | 99.56 | 99.47 | | 12 day EMA | 99.28 | 99.17 | 99.06 | | 20 day EMA | 98.8 | 98.69 | | 35 day EMA | 0 | 0 | 0 | | 50 day EMA | 0 | 0 | 0 |
SMA (simple moving average) of Goi Tbill 91D300125_TB
| SMA period | SMA current | SMA prev | SMA prev2 | | 5 day SMA | 99.66 | 99.61 | 99.48 | | 12 day SMA | 99.18 | 99.08 | 98.99 | | 20 day SMA | | 35 day SMA | | 50 day SMA | | 100 day SMA | | 150 day SMA | | 200 day SMA |
|
|
