GoiTbill 91D280825_TB full analysis,charts,indicators,moving averages,SMA,DMA,EMA,ADX,MACD,RSIGoi Tbill 91D280825_TB WideScreen charts, DMA,SMA,EMA technical analysis, forecast prediction, by indicators ADX,MACD,RSI,CCI NSE stock exchange
Daily price and charts and targets GoiTbill Strong Daily Stock price targets for GoiTbill 91D280825_TB are 98.87 and 98.88 | Daily Target 1 | 98.86 | | Daily Target 2 | 98.87 | | Daily Target 3 | 98.873333333333 | | Daily Target 4 | 98.88 | | Daily Target 5 | 98.88 |
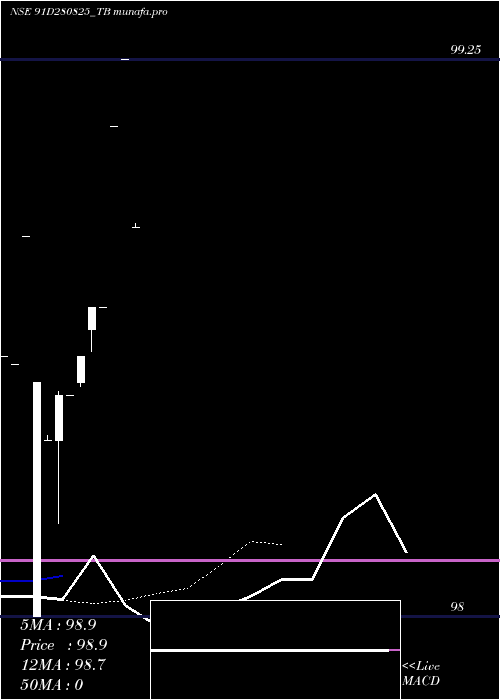
Daily price and volume Goi Tbill
| Date |
Closing |
Open |
Range |
Volume |
Fri 11 July 2025 |
98.87 (-0.38%) |
98.87 |
98.87 - 98.88 |
0.4 times |
Wed 09 July 2025 |
99.25 (0.15%) |
99.25 |
99.25 - 99.25 |
0.2 times |
Tue 01 July 2025 |
99.10 (0.41%) |
99.10 |
99.10 - 99.10 |
0.2 times |
Wed 18 June 2025 |
98.70 (0%) |
98.70 |
98.70 - 98.70 |
0.6 times |
Tue 17 June 2025 |
98.70 (0.11%) |
98.65 |
98.60 - 98.70 |
1.2 times |
Mon 16 June 2025 |
98.59 (0.09%) |
98.53 |
98.52 - 98.59 |
1.2 times |
Fri 13 June 2025 |
98.50 (0%) |
98.50 |
98.50 - 98.50 |
0.4 times |
Thu 12 June 2025 |
98.50 (0.1%) |
98.40 |
98.21 - 98.51 |
1.2 times |
Wed 11 June 2025 |
98.40 (-0.13%) |
98.40 |
98.40 - 98.41 |
2.2 times |
Tue 10 June 2025 |
98.53 (-0.32%) |
98.00 |
98.00 - 98.53 |
2.4 times |
Mon 09 June 2025 |
98.85 (0.28%) |
98.85 |
98.85 - 98.85 |
0.2 times |
Weekly price and charts GoiTbill Strong weekly Stock price targets for GoiTbill 91D280825_TB are 98.68 and 99.06 | Weekly Target 1 | 98.62 | | Weekly Target 2 | 98.74 | | Weekly Target 3 | 98.996666666667 | | Weekly Target 4 | 99.12 | | Weekly Target 5 | 99.38 |
Weekly price and volumes for Goi Tbill
| Date |
Closing |
Open |
Range |
Volume |
Fri 11 July 2025 |
98.87 (0.17%) |
99.10 |
98.87 - 99.25 |
0.2353 times |
Wed 18 June 2025 |
98.70 (0.2%) |
98.53 |
98.52 - 98.70 |
0.8824 times |
Fri 13 June 2025 |
98.50 (0%) |
98.85 |
98.00 - 98.85 |
1.8824 times |
Sat 12 July 2025 |
(0%) |
|
- |
0 times |

Monthly price and charts GoiTbill Strong monthly Stock price targets for GoiTbill 91D280825_TB are 98.68 and 99.06 | Monthly Target 1 | 98.62 | | Monthly Target 2 | 98.74 | | Monthly Target 3 | 98.996666666667 | | Monthly Target 4 | 99.12 | | Monthly Target 5 | 99.38 |
Monthly price and volumes Goi Tbill
| Date |
Closing |
Open |
Range |
Volume |
Fri 11 July 2025 |
98.87 (0.17%) |
99.10 |
98.87 - 99.25 |
0.1429 times |
Wed 18 June 2025 |
98.70 (0%) |
98.59 |
98.00 - 98.85 |
1.8571 times |
Sat 12 July 2025 |
(0%) |
|
- |
0 times |

DMA SMA EMA moving averages of Goi Tbill 91D280825_TB
DMA (daily moving average) of Goi Tbill 91D280825_TB
| DMA period | DMA value | | 5 day DMA | 98.92 | | 12 day DMA | | | 20 day DMA | | | 35 day DMA | | | 50 day DMA | | | 100 day DMA | | | 150 day DMA | | | 200 day DMA | | EMA (exponential moving average) of Goi Tbill 91D280825_TB
| EMA period | EMA current | EMA prev | EMA prev2 | | 5 day EMA | 98.92 | 98.94 | 98.79 | | 12 day EMA | 98.72 | 98.69 | | 20 day EMA | 0 | 0 | 0 | | 35 day EMA | 0 | 0 | 0 | | 50 day EMA | 0 | 0 | 0 |
SMA (simple moving average) of Goi Tbill 91D280825_TB
| SMA period | SMA current | SMA prev | SMA prev2 | | 5 day SMA | 98.92 | 98.87 | 98.72 | | 12 day SMA | | 20 day SMA | | 35 day SMA | | 50 day SMA | | 100 day SMA | | 150 day SMA | | 200 day SMA |
|
|
